
> Applied Bioinformatics > Comparative Genomics and Evolutionary Analysis > Chart Evolutionary Histories: Demystifying Phylogenetic Trees in Bioinformatics
Chart Evolutionary Histories: Demystifying Phylogenetic Trees in Bioinformatics

Unlock the secrets embedded within life's vast tapestry. In the realm of biology, understanding evolutionary relationships is not merely academic; it is foundational to every discovery, every innovation. We stand at the precipice of a bioinformatic revolution, where data-driven insights forge our path forward.
This deep dive dissects the phylogenetic tree, an indispensable visual and analytical tool that maps the evolutionary journey of species, genes, or populations. We explore its architecture, decode its implications, and master its construction, transforming complex data into clear narratives of descent and divergence. From tracing pathogen outbreaks to reclassifying species, phylogenetic trees empower critical decisions in applied bioinformatics. Prepare to revolutionize your approach to evolutionary analysis, leveraging the robust framework of computational methods for comparative genomics to unlock unprecedented understanding.
This resource equips you with the expert knowledge to not only interpret these intricate diagrams but to construct them with precision and confidence, ensuring your analyses stand as pillars of scientific rigor.
Forging the Foundations: What is a Phylogenetic Tree?
A phylogenetic tree is a hypothesis about the evolutionary relationships among a set of organisms or entities. It serves as a graphical representation, a historical map, depicting the ancestral lineage and the divergence events that have shaped biodiversity. Fundamentally, these trees are central to bioinformatics, providing an intuitive framework to interpret genetic data within an evolutionary context. We deploy them to visualize patterns of descent, identifying common ancestors and measuring evolutionary distance.
Understanding the core components of a tree is paramount. Every tree comprises nodes, branches, and leaves. The leaves, or terminal nodes, represent the operational taxonomic units (OTUs)—the individual species, genes, or sequences we are analyzing. Internal nodes symbolize hypothetical ancestral units, points where lineages diverged from a common ancestor. The branches connect these nodes, representing the evolutionary path and the passage of time. The length of these branches often quantifies the amount of evolutionary change or genetic distance between entities. A critical distinction lies between rooted and unrooted trees: a rooted tree explicitly indicates the most recent common ancestor of all OTUs (the root), providing a clear directional sense of evolution. Unrooted trees, conversely, illustrate only the relationships and distances, leaving the position of the root ambiguous.
Furthermore, we classify trees by their visual representation: cladograms show only branching order, implying relative recency of common ancestry without specifying branch lengths; phylograms use branch lengths proportional to the amount of evolutionary change; and chronograms are phylograms where branch lengths are scaled to represent actual time, often inferred from fossil records or molecular clock models. Recognizing these distinctions is the first step toward effective tree interpretation and robust comparative genomics.

Engineering Evolutionary Maps: Data & Construction Methodologies
Constructing a phylogenetic tree demands a strategic approach, commencing with meticulous data selection and preparation. The bedrock of most phylogenetic analyses is molecular sequence data—DNA, RNA, or protein sequences. High-quality data is non-negotiable; sequence alignment is the critical initial step. We align homologous sequences, ensuring that corresponding positions across different taxa are correctly matched. Inaccurate alignments propagate errors throughout the entire analysis, yielding spurious evolutionary relationships. Tools like MAFFT, Clustal Omega, or T-Coffee are indispensable for generating robust multiple sequence alignments.
Once aligned, we select a construction methodology. These methods fall broadly into two categories: distance-based and character-based. Distance-based methods, such as UPGMA (Unweighted Pair Group Method with Arithmetic Mean) and Neighbor-Joining (NJ), compute a pairwise genetic distance matrix from the aligned sequences. They then build the tree by iteratively joining the closest pairs of taxa. UPGMA assumes a constant molecular clock, a significant limitation, while NJ is more flexible, not strictly requiring a clock, making it widely applicable for initial tree reconstructions due to its computational speed.
Character-based methods, in contrast, directly analyze the individual character states (e.g., A, T, C, G at each position). Maximum Parsimony (MP) seeks the tree that requires the fewest evolutionary changes (mutations) to explain the observed sequence data. While conceptually intuitive, MP can become computationally intensive for large datasets. Maximum Likelihood (ML) methods evaluate the probability of the observed data given a particular tree topology and a specific evolutionary model, aiming to find the tree that maximizes this likelihood. ML is statistically consistent and generally produces highly accurate trees but demands substantial computational power. Finally, Bayesian inference (BI), an extension of ML, calculates posterior probabilities of trees, integrating uncertainty in model parameters and yielding robust statistical support for branches. Each method carries inherent assumptions and computational costs; choosing the right one is a strategic decision tailored to your data and research question.
Interpreting & Validating Evolutionary Insights: Best Practices & Pitfalls
Decoding a phylogenetic tree extends beyond mere visual inspection; it demands a critical understanding of its inherent limitations and robust validation. We interpret trees as hypotheses, not absolute truths. Branch lengths in phylograms typically represent evolutionary changes, allowing us to infer which lineages have experienced more mutations. A longer branch signifies greater genetic divergence. However, it is crucial to recognize that the absolute length does not always equate to time unless calibrated by external data, such as fossil records, to create a chronogram. Node order illustrates evolutionary relationships, with closer nodes indicating more recent common ancestry. Always verify the rooting of your tree, as an incorrectly rooted tree can lead to fundamentally flawed evolutionary interpretations.
Assessing the statistical confidence of branches is paramount. The bootstrap resampling method is a cornerstone for this validation. We generate numerous resampled datasets from our original alignment, construct a tree for each, and then count how many times a particular branch (clade) appears across all trees. A bootstrap value above 70% generally indicates strong support, while values below 50% suggest weak or ambiguous support, warranting cautious interpretation. Bayesian inference provides a similar measure through posterior probabilities, with values above 0.95 considered strong support.
Beware of common pitfalls. Long-branch attraction (LBA) is a notorious artifact where rapidly evolving lineages are incorrectly grouped together simply because they have accumulated many mutations independently. Mitigate LBA by using appropriate evolutionary models, increasing taxon sampling, or employing methods less susceptible to this bias. Alignment errors are another frequent source of misinformation; carefully inspect your alignment, especially in regions of high variability. Insufficient data or biased taxon sampling can also distort relationships. A best practice involves testing multiple reconstruction methods and evolutionary models. If different robust methods yield consistent tree topologies, our confidence in the inferred relationships strengthens considerably. Remember, a phylogenetic tree is a model; its utility lies in its ability to approximate reality, guided by rigorous statistical validation and expert biological interpretation.
Activating Knowledge: Applied Bioinformatics & Real-World Applications
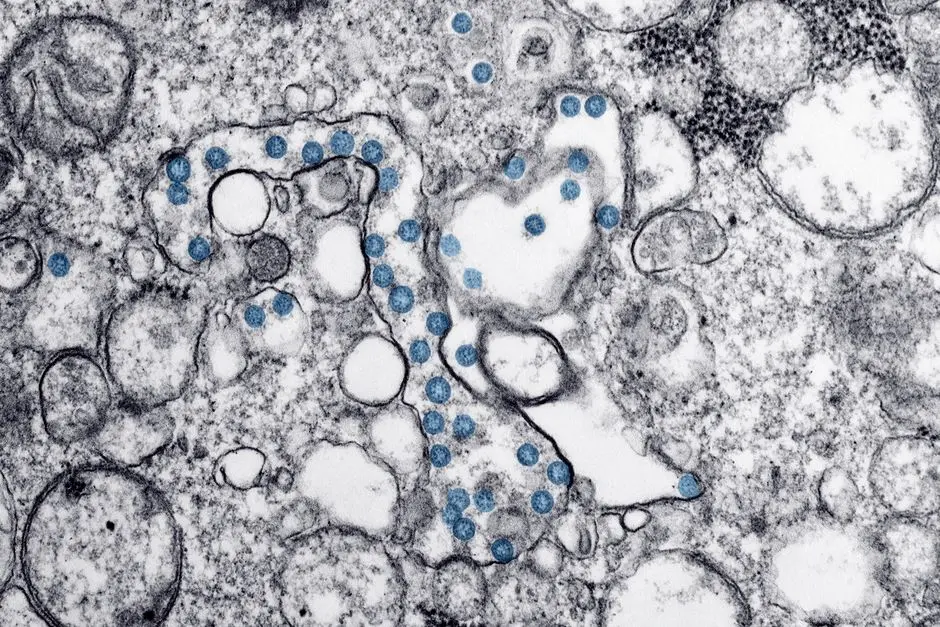
The power of phylogenetic trees transcends theoretical biology; it fuels tangible advancements across diverse fields of applied bioinformatics. We leverage these evolutionary maps to tackle some of humanity's most pressing challenges and unravel complex biological phenomena. In disease tracking and epidemiology, phylogenetic analysis is indispensable for understanding the spread and evolution of pathogens. For instance, by building trees from viral genomes (e.g., SARS-CoV-2, influenza, HIV), we identify origins of outbreaks, track transmission routes, detect emergence of new variants with altered virulence or drug resistance, and inform public health interventions. This real-time evolutionary surveillance is a cornerstone of modern pandemic response.
Within drug discovery and development, phylogenetic insights guide the design of new therapeutics. Understanding the evolutionary relationships among gene families or protein domains can predict functional similarities or divergences, helping us target specific pathways or develop broad-spectrum drugs. For example, comparing the evolution of drug target proteins across different species can reveal conserved regions suitable for drug binding, or divergent regions that explain species-specific drug efficacy or side effects. This precision in targeting accelerates innovation.
Furthermore, phylogenetic trees are critical for species identification and classification, especially for cryptic species or difficult-to-culture microorganisms. DNA barcoding, reliant on phylogenetic principles, uses short, standardized gene sequences to identify species, revolutionizing biodiversity assessment and forensic science. In conservation biology, trees inform decisions on prioritizing species or populations for protection based on their evolutionary distinctiveness. We also apply them to reconstruct the evolution of gene families, predicting gene function based on orthology and paralogy, and elucidating the mechanisms of gene duplication and specialization. The capacity to translate complex genomic data into actionable evolutionary insights makes phylogenetic trees an indispensable weapon in the bioinformatician's arsenal, propelling us toward a deeper understanding of life and its intricate processes.
Key Takeaways
Phylogenetic Trees: Core Concepts
Phylogenetic trees visually map evolutionary relationships, acting as hypotheses of descent. Key components include:
- Leaves (OTUs): Represent individual species, genes, or sequences analyzed.
- Internal Nodes: Hypothesized common ancestors where lineages diverge.
- Branches: Evolutionary pathways, with lengths often indicating genetic change.
- Root: The most recent common ancestor of all OTUs (in rooted trees).
Construction Workflow: From Data to Tree
1. Data Collection: Obtain high-quality molecular sequences (DNA, RNA, proteins).
2. Sequence Alignment: Crucial step matching homologous positions; use tools like MAFFT, Clustal Omega. Inaccuracies here compromise the entire analysis.
3. Method Selection: Choose between:
- Distance-Based Methods (e.g., Neighbor-Joining): Fast, use pairwise genetic distances.
- Character-Based Methods (e.g., Maximum Parsimony, Maximum Likelihood, Bayesian Inference): More rigorous, analyze individual character states, often more computationally intensive but statistically robust.
Validation & Best Practices
Always validate tree branches with statistical support:
- Bootstrap Resampling: Generates multiple trees from resampled data; values >70% suggest strong support.
- Posterior Probabilities (Bayesian): Values >0.95 indicate strong support.
- Long-Branch Attraction (LBA): Misgrouping of rapidly evolving lineages.
- Alignment Errors: Leads to fundamental inaccuracies.
- Insufficient Data/Biased Sampling: Can distort true relationships.
Impact in Applied Bioinformatics
Phylogenetic trees are vital for:
- Disease Tracking: Monitor pathogen evolution, trace outbreaks (e.g., SARS-CoV-2 variants).
- Drug Discovery: Identify conserved drug targets, predict functional similarities across species.
- Species Identification & Classification: DNA barcoding, resolving cryptic species.
- Conservation Biology: Prioritize species for protection based on evolutionary distinctiveness.
- Gene Family Evolution: Understand gene duplication, functional divergence, orthology/paralogy.
FAQ
-
What kind of data do we use to build phylogenetic trees?
We primarily utilize molecular data, including DNA, RNA, and protein sequences. The choice of sequence type depends on the evolutionary scale and the specific research question. For deep evolutionary histories, we often use slowly evolving genes, while for recent divergence events, rapidly evolving non-coding regions or mitochondrial DNA prove more informative. Additionally, morphological or physiological character data can be used, though less common in modern bioinformatics.
-
How reliable are phylogenetic trees, and how do we assess their accuracy?
Phylogenetic trees are hypotheses, not definitive truths. Their reliability depends on the quality of the input data, the appropriateness of the evolutionary model, and the robustness of the construction method. We assess accuracy primarily through statistical support measures like bootstrap resampling (for Maximum Parsimony and Maximum Likelihood) or posterior probabilities (for Bayesian inference). High support values (e.g., >70% bootstrap or >0.95 posterior probability) indicate strong confidence in a particular branching pattern.
-
Which software tools are essential for phylogenetic tree construction?
Numerous powerful tools are available. For sequence alignment, we commonly employ MAFFT, Clustal Omega, or T-Coffee. For tree construction, key software includes MEGA (user-friendly, implements NJ, UPGMA, MP, ML), RAxML or IQ-TREE (highly optimized for ML), and MrBayes (for Bayesian inference). PHYLIP is a comprehensive package with many classical methods. These tools offer robust algorithms and extensive options for model selection and tree validation.
-
Can phylogenetic trees show actual evolutionary time?
Yes, but with careful calibration. Standard phylograms depict evolutionary change (e.g., number of substitutions per site) through branch lengths, not directly time. To represent actual time, we construct chronograms. This requires incorporating external data, such as fossil records that provide minimum divergence times, or utilizing a 'molecular clock' hypothesis calibrated against known geological or historical events. Tools like BEAST or r8s can estimate divergence times by integrating sequence data with calibration points.