
> New Molecule Discovery > Molecular Docking Techniques > Illuminate Molecular Bonds: Decoding Docking Visualizations
Illuminate Molecular Bonds: Decoding Docking Visualizations
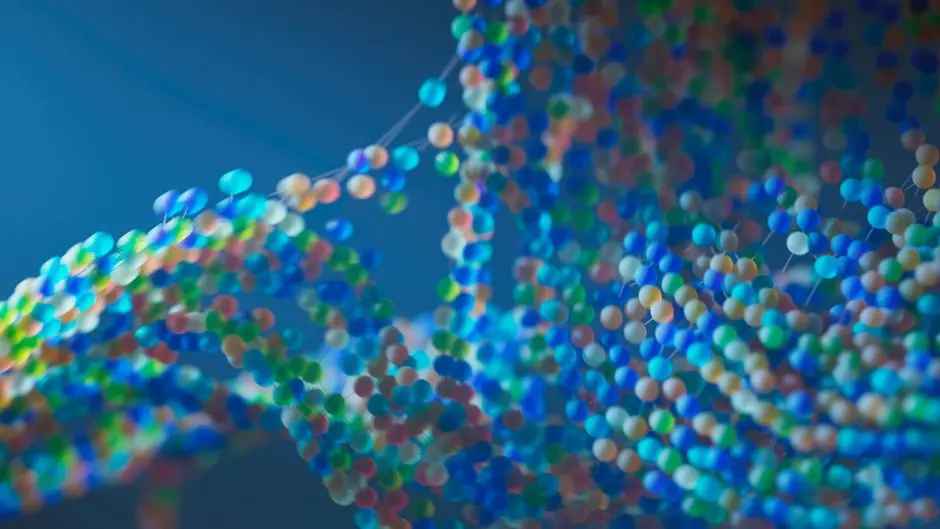
In the relentless pursuit of novel therapeutics, our capacity to unravel the intricate dance between molecules stands as a cornerstone of drug discovery. Predicting how a small molecule, a potential drug candidate, interacts with a larger biological target, like a protein, is paramount. Yet, mere computational scores fall short; the true revelation emerges when we visualize these interactions, transforming abstract data into actionable insights.
This article catapults us into the heart of molecular visualization, specifically focusing on how to effectively interpret and present docking interactions. We move beyond simplistic representations to master the art of uncovering critical binding mechanisms. Forgeons une compréhension approfondie des outils, des techniques et des pièges à éviter, garantissant que chaque visualisation devienne une fenêtre transparente sur la biomécanique des liaisons moléculaires. Learn to exploit the power of advanced docking methodologies, where visual clarity dictates the speed and success of your research. Nous décryptons les secrets pour non seulement voir, mais réellement comprendre l'affinité et la spécificité des interactions, optimisant ainsi votre trajectoire de découverte de molécules.
Establishing the Visual Blueprint: Core Principles of Docking Visualization
Visualizing docking interactions is not merely about generating pretty pictures; it’s about extracting profound biological meaning from complex computational data. We embark on this journey by first grasping the fundamental components that form our visual blueprint. At its core, a molecular docking model comprises a ligand – our potential drug molecule – and a receptor – the biological target, often a protein or nucleic acid. The crux lies within the binding site, the specific region on the receptor where the ligand purportedly docks.
Our initial objective is to clearly distinguish these elements. Software like PyMOL, VMD, or Chimera provide indispensable frameworks for this. We commence by loading our receptor structure (typically from a PDB file) and the docked ligand pose (from a PDBQT, SDF, or mol2 file). A critical first step involves orienting the complex to optimally display the binding pocket. We employ surface representations for the receptor to delineate its shape and solvent accessibility, often coloring by atom type or charge to highlight chemical properties. The ligand, usually rendered in stick or ball-and-stick models, is then positioned within this context.
Understanding the interplay begins with identifying different interaction types: hydrogen bonds (H-bonds), hydrophobic contacts, electrostatic interactions (salt bridges), and pi-stacking or pi-cation interactions. Each type signifies a distinct mode of molecular recognition, crucial for binding affinity and specificity. We learn to visualize H-bonds as dashed lines between donor and acceptor atoms, hydrophobic contacts as spheres or surfaces indicating proximity, and electrostatic interactions by mapping charge distribution onto the receptor surface. Our initial setup must prioritize clarity, ensuring that no essential interaction is obscured by superfluous visual clutter. This foundational understanding equips us to move from simply viewing a static image to actively interpreting the forces that govern molecular association.
Deciphering Interaction Maps: Advanced Techniques for Granular Analysis
With our foundational blueprint established, we escalate our visualization strategy to a granular level, deconstructing the intricate interaction maps that dictate binding efficacy. We move beyond simple overlays to employ techniques that precisely highlight the nature and strength of molecular contacts. 2D interaction plots, generated by tools like LigPlot+ or PoseView, offer an indispensable bird's-eye view, detailing specific residues involved in H-bonds and hydrophobic contacts without the visual complexity of 3D models. These plots serve as rapid diagnostic tools, quickly identifying key binding hot spots.
However, the true depth of understanding unfolds in 3D. We master the rendering of precise distances between interacting atoms using explicit distance labels, particularly crucial for validating H-bond lengths (typically 2.5-3.5 Å) and other close contacts. Electrostatic potential maps, projected onto the receptor surface, reveal regions of positive and negative charge, illuminating the driving forces behind ionic interactions and guiding rational design. Hydrophobic contacts are often best represented using spheres or concentric circles around interacting atoms, signifying lipophilic complementarity. For pi-stacking, we specifically highlight aromatic rings and their parallel or T-shaped orientations.
A common pitfall is over-visualizing, which can lead to confusion. Our strategy focuses on judiciously selecting which interactions to display based on their chemical significance. For instance, weak van der Waals contacts, while present, might be omitted in favor of stronger, more specific interactions. We leverage color schemes to categorize different interaction types consistently across multiple views, enhancing interpretability. Transparency settings for receptor surfaces allow us to peer into buried binding pockets, revealing hidden contacts. This advanced analytical approach transforms our visualizations into precise instruments for probing the molecular mechanics of drug-target recognition.
Dynamic Insights and Overcoming Visual Traps: A Specialist's Perspective
While static snapshots provide immense value, the biological world is inherently dynamic. Our journey into advanced visualization demands integrating dynamic insights, particularly from molecular dynamics (MD) simulations. Visualizing MD trajectories, where the ligand-receptor complex evolves over time, unveils conformational flexibility, the stability of interactions, and the potential for induced fit mechanisms. Software capable of animating these trajectories, often coupled with root-mean-square deviation (RMSD) plots, allows us to observe fluctuations in binding poses and identify transient but critical interactions. This offers a more physiologically relevant understanding than any single docked pose alone.
A specialist’s perspective also emphasizes anticipating and overcoming common visual traps and misinterpretations. One prevalent error is mistaking proximity for interaction. Not every close contact is a significant binding interaction; we must apply chemical intuition and validate bond types. Another trap is neglecting the solvent environment; water molecules can mediate interactions, and their omission can lead to an incomplete picture. Artifacts from docking algorithms, such as sterically hindered poses or improbable bond angles, must be rigorously scrutinized. Our expert approach involves cross-referencing visual data with scoring functions and, ideally, with available experimental structural data (e.g., X-ray crystallography) to validate our interpretations.
We actively seek out subtle changes: even slight shifts in ligand orientation or receptor side-chain rotamers can significantly impact affinity. An insider's tip: always generate multiple views from different angles. What is obscured in one view might be strikingly clear in another. Furthermore, focusing on the chemical environment of key active site residues – their pKa values, hydrophobicity, and potential for protonation – adds another layer of sophistication to our visual analysis. This proactive identification of potential pitfalls refines our analytical precision, ensuring robust and reliable interpretation of docking interactions.

Forging Publication-Quality Visuals: Optimizing Workflow and Customization
The provided PyMOL script snippet demonstrates a streamlined approach to visualize a docking complex. It first hides all default representations, then displays the receptor as a gray cartoon, and the ligand as red sticks. Crucially, it then identifies and visualizes hydrogen bonds between the ligand and receptor within a 3.2 Å distance, setting their color to blue and adjusting the dash gap for clarity. This exemplifies how targeted scripting allows for rapid, consistent, and highly customized visual analysis, transforming abstract data into an interpretable interaction map. Such automation is indispensable in a high-throughput drug discovery pipeline, ensuring reproducibility and reducing manual error.
hide all<br>show cartoon, receptor<br>color gray, receptor<br>show sticks, ligand<br>color red, ligand<br>preset sticks<br>util.measure_hbonds ligand, receptor, 3.2, 0<br>set h_bond_dash_gap, 0.2<br>set h_bond_color, blueKey Takeaways
Core Principles: Foundations of Docking Visualization
Mastering docking visualization begins with clearly identifying the ligand, receptor, and binding site. Utilize surface representations for the receptor and stick models for the ligand. Focus on distinguishing key interaction types like hydrogen bonds, hydrophobic contacts, and electrostatic interactions. Initial setup must prioritize visual clarity using tools like PyMOL, VMD, or Chimera to orient and display the complex effectively. This groundwork is essential for interpreting molecular recognition.
Granular Analysis: Deciphering Interaction Maps
Elevate analysis by employing both 2D interaction plots (e.g., LigPlot+) for rapid overview and detailed 3D representations. Precisely visualize H-bond lengths, map electrostatic potential, and highlight hydrophobic and pi-stacking interactions. Critically, avoid visual clutter by selectively displaying the most chemically significant interactions. Consistent color schemes and transparency settings enhance the interpretability of complex molecular contacts, transforming observation into precise insight.
Advanced Insights: Dynamics and Pitfalls to Avoid
Integrate dynamic insights from molecular dynamics (MD) simulations to observe conformational changes and interaction stability over time. Beware of common visual traps: don't mistake proximity for interaction, consider the solvent environment, and rigorously scrutinize docking artifacts. Validate visual interpretations against scoring functions and experimental data. A specialist's approach involves actively seeking subtle changes and utilizing multiple viewing angles for comprehensive analysis.
Workflow Optimization: Forging Publication-Quality Visuals
Optimize your workflow by selecting the appropriate visualization software for specific tasks (e.g., PyMOL for scripting). Leverage scripting and automation to ensure consistency and efficiency in generating figures. Develop personalized visualization templates for standardized output. Focus on high resolution, clear labeling, appropriate lighting, and export in optimal formats for publication. Meticulous version control for scripts is crucial for reproducibility and quality control.
FAQ
-
What is the primary goal of visualizing docking interactions?
The primary goal extends beyond mere observation; it is to deeply understand the molecular forces and specific atomic contacts that govern the binding of a ligand to its receptor. This comprehension is critical for validating docking results, rationalizing binding affinity, and guiding the design of more potent and selective drug candidates. We aim to transform complex data into clear, actionable biological insights.
-
Which software tools are recommended for visualizing docking results?
Several powerful tools are industry standards. PyMOL is highly favored for its extensive customization, scriptability, and publication-quality rendering capabilities. VMD (Visual Molecular Dynamics) excels in handling large molecular dynamics trajectories. UCSF Chimera/ChimeraX offers intuitive interfaces for various molecular visualizations, including cryo-EM data. The choice often depends on the specific task and user familiarity.
-
How can I identify common errors or artifacts in my docking visualizations?
Identifying errors requires critical assessment. Look for physically improbable interactions, such as sterically clashing atoms or hydrogen bonds with incorrect geometries. Validate interaction distances against known chemical ranges (e.g., H-bond lengths of 2.5-3.5 Å). Cross-reference with the docking score and, if possible, experimental structural data. Over-reliance on automated interaction detection without manual inspection is a common pitfall.
-
What defines a 'publication-quality' image in molecular visualization?
Publication-quality images are characterized by high resolution (typically >300 DPI), clarity, and accurate representation of molecular features. They should be uncluttered, with appropriate lighting, shadows, and color schemes that enhance interpretability. All relevant elements must be clearly labeled, and the overall aesthetic should be professional and consistent, adhering to journal guidelines.