
> Biological Data Analysis > Biological Data Processing Workflows > Automate Bio Data Processing: Essential Workflows & Examples
Automate Bio Data Processing: Essential Workflows & Examples
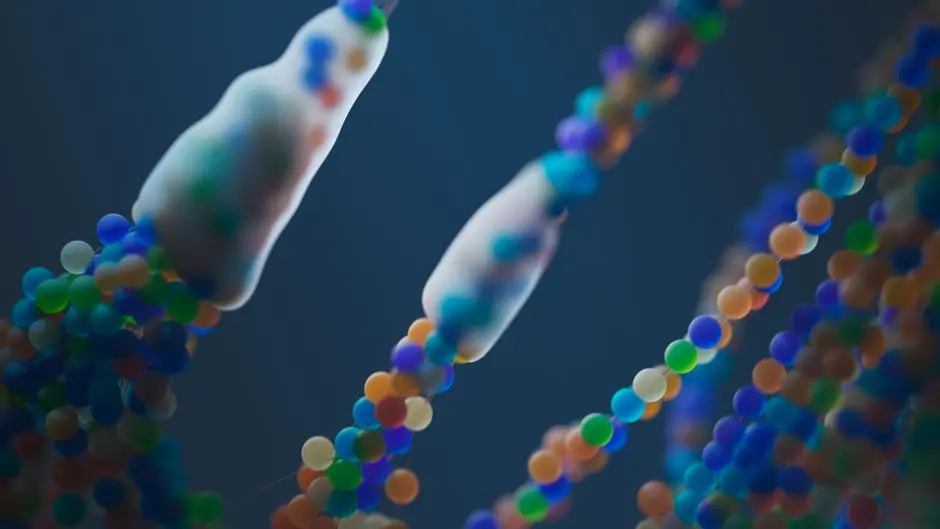
The biological sciences stand at the precipice of a data revolution. The sheer volume and complexity of data generated from next-generation sequencing, mass spectrometry, and high-throughput imaging demand innovative solutions. Manual processing is no longer sustainable; it introduces bottlenecks, amplifies human error, and impedes the pace of discovery. We must now turn to automation, transforming raw data into actionable insights with unparalleled speed and precision.
This resource carves a path through the landscape of automated biological data processing, offering concrete examples that illustrate its transformative power. We dissect the fundamental principles, showcase diverse applications across genomics, proteomics, and imaging, and equip you with the strategic foresight to implement robust, scalable workflows. Discover how the systematic implementation of automated biological data pipelines, a critical component of effective data management, empowers researchers to conquer data overload and accelerate scientific breakthroughs. Uncover the essential tools and methodologies that will elevate your research capabilities and propel your projects forward. Prepare to forge a future where biological data analysis is not just faster, but fundamentally smarter.
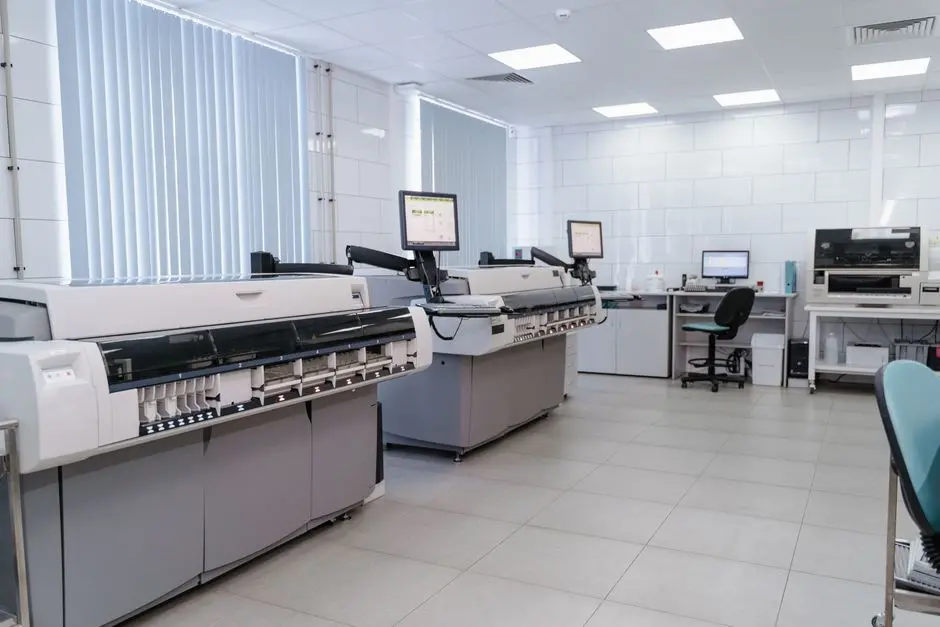
Establishing Automated Biological Data Workflows: Principles and Power
We embark on a journey to master automated biological data processing, a critical discipline transforming modern biology. The explosive growth of high-throughput experimental techniques—from genomics to single-cell analysis—floods laboratories with petabytes of data. Manually sifting through this deluge is not merely inefficient; it is fundamentally impossible. Automation emerges as our indispensable ally, enabling us to manage, analyze, and interpret these vast datasets with unprecedented scale and reproducibility. It fundamentally shifts our focus from tedious data manipulation to hypothesis testing and biological discovery.
At its core, automated biological data processing involves orchestrating a series of computational steps to transform raw experimental outputs into refined, interpretable results. This orchestration relies on defining clear, reproducible workflows, often implemented using scripting languages like Python or R, or specialized workflow management systems. The benefits are manifold and immediate: we eliminate human error, guarantee consistent results across experiments and researchers, and drastically reduce processing times. This efficiency frees up invaluable researcher time, allowing our teams to concentrate on advanced analysis, experimental design, and critical thinking rather than repetitive computational tasks. We seize the opportunity to accelerate discovery, scale our research endeavors, and foster a culture of data-driven innovation.
A key principle in forging these automated workflows is modularity. We construct pipelines from discrete, interchangeable components, each performing a specific task, such as quality control, alignment, or variant calling. This modular design enhances flexibility, allowing us to adapt workflows to new data types or analytical questions with minimal effort. Furthermore, establishing clear input/output specifications for each module ensures interoperability and simplifies troubleshooting. We also prioritize version control for all scripts and software dependencies, securing the reproducibility of our analyses over time. Neglecting this crucial step invites inconsistency and invalidates future comparisons. By embracing these foundational principles, we lay the groundwork for robust, reliable, and highly efficient biological data processing systems.
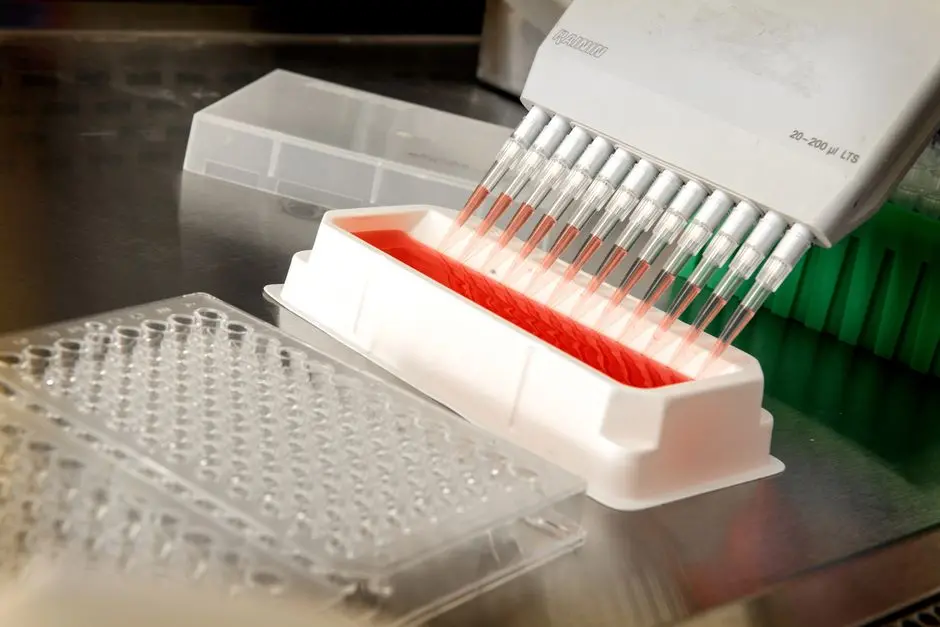
Automating Genomics Data Processing: From Reads to Revelations
Next-Generation Sequencing (NGS) has become the cornerstone of modern biological research, generating colossal volumes of data from whole-genome sequencing, RNA-seq, ChIP-seq, and more. Processing this data manually is inconceivable. We harness automation to transform raw sequencing reads into meaningful biological insights. A typical automated NGS workflow begins with stringent quality control. Tools like FastQC rapidly assess raw read quality, flagging issues such as adapter contamination or low-quality bases. We integrate these checks into the pipeline, often followed by trimming steps using software like Trimmomatic or Cutadapt, ensuring only high-quality data proceeds to subsequent stages.
Following quality control, the core task involves aligning sequencing reads to a reference genome. Tools such as BWA (Burrows-Wheeler Aligner) or Bowtie efficiently map millions of short reads to their genomic origins. This alignment generates SAM/BAM files, which are then sorted and indexed using utilities like Samtools. These steps are compute-intensive but perfectly suited for automation, running without human intervention on high-performance computing clusters. Automating alignment guarantees consistency across samples, an absolute imperative for comparative genomics or variant analysis, preventing discrepancies that arise from manual command execution or parameter misconfigurations.
The subsequent critical phase, variant calling, identifies genetic differences (SNPs, indels) between samples and the reference genome. Powerful suites like GATK (Genome Analysis Toolkit) provide a comprehensive set of tools for this purpose, including base quality recalibration, indel realignment, and variant detection with HaplotypeCaller. Automating GATK best practices, including filtering and annotation, is paramount for generating reliable variant calls. We often integrate publicly available databases like dbSNP or ClinVar for automated variant annotation, linking genetic changes to known biological functions or disease associations. This end-to-end automation, from raw reads to annotated variants, empowers us to rapidly identify disease-causing mutations, discover novel gene fusions, or characterize population genetic diversity, pushing the boundaries of precision medicine and evolutionary biology.
<code>
# Example of a simplified shell script for NGS data processing workflow
# This is illustrative and would involve specific tools like FastQC, BWA, samtools, GATK

# --- Configuration Variables ---
FASTQ_DIR="/path/to/fastq_files"
GENOME_REF="/path/to/reference_genome.fa"
OUTPUT_DIR="/path/to/output"
NUM_THREADS=8

mkdir -p ${OUTPUT_DIR}/qc
mkdir -p ${OUTPUT_DIR}/aligned
mkdir -p ${OUTPUT_DIR}/variants

# --- Step 1: Quality Control ---
for fq1 in ${FASTQ_DIR}/*_R1.fastq.gz;
do
    fq2=${fq1/_R1.fastq.gz/_R2.fastq.gz}
    base=$(basename ${fq1} _R1.fastq.gz)
    echo "Running FastQC on ${base}"
    fastqc -o ${OUTPUT_DIR}/qc ${fq1} ${fq2}
done

# --- Step 2: Alignment ---
for fq1 in ${FASTQ_DIR}/*_R1.fastq.gz;
do
    fq2=${fq1/_R1.fastq.gz/_R2.fastq.gz}
    base=$(basename ${fq1} _R1.fastq.gz)
    echo "Aligning ${base} to reference genome"
    bwa mem -t ${NUM_THREADS} ${GENOME_REF} ${fq1} ${fq2} \
        | samtools view -Sb - > ${OUTPUT_DIR}/aligned/${base}.bam
    samtools sort -o ${OUTPUT_DIR}/aligned/${base}.sorted.bam ${OUTPUT_DIR}/aligned/${base}.bam
    samtools index ${OUTPUT_DIR}/aligned/${base}.sorted.bam
done

# --- Step 3: Variant Calling (Illustrative, would involve GATK/FreeBayes etc.) ---
# This part is highly dependent on specific tools and parameters, e.g., GATK HaplotypeCaller
# For simplicity, we assume an already processed BAM for variant calling
# for bam in ${OUTPUT_DIR}/aligned/*.sorted.bam;
# do
#     base=$(basename ${bam} .sorted.bam)
#     echo "Calling variants for ${base}"
#     gatk HaplotypeCaller -R ${GENOME_REF} -I ${bam} -O ${OUTPUT_DIR}/variants/${base}.vcf
# done

echo "NGS Data Processing Workflow Completed!"
</code>
Automated Processing for Proteomics and Metabolomics Data
Proteomics and metabolomics, the large-scale study of proteins and metabolites, respectively, generate highly complex mass spectrometry (MS) data. Extracting meaningful biological information from these intricate spectral patterns demands sophisticated automated pipelines. For proteomics, raw MS/MS data files (e.g., .mzML, .raw) undergo a series of automated steps. Initial processing often involves peak picking and deconvolution to simplify complex spectra. We then apply database searching algorithms, such as Mascot, Sequest, or Andromeda (MaxQuant), which automatically match experimental MS/MS spectra against theoretical spectra derived from protein sequence databases. This automated identification of peptides and subsequent inference of proteins is the bedrock of quantitative proteomics.
Quantitative proteomics requires further automated processing. For label-free quantification, software like MaxQuant or Progenesis QI automatically align chromatograms, detect features, and calculate protein abundances across multiple samples. If isotopic labeling (e.g., TMT, iTRAQ, SILAC) is employed, automated workflows quantify reporter ions or peptide ratios to determine relative protein expression levels. A critical automation step here is statistical analysis, where differential expression analysis (e.g., using limma or DESeq2 packages in R) is applied to identify significantly altered proteins between experimental conditions. These automated pipelines ensure unbiased and robust quantification, eliminating subjective manual intervention and accelerating the discovery of biomarkers or perturbed pathways.
Metabolomics data processing follows a similar automation paradigm. Raw MS data from techniques like LC-MS or GC-MS are first subjected to automated peak detection, alignment, and retention time correction to compensate for experimental variability. Software suites such as XCMS, MetaboAnalyst, or MZmine 2 are invaluable for these tasks, automatically extracting hundreds to thousands of metabolite features. Subsequently, automated identification involves searching against spectral libraries (e.g., METLIN, HMDB) or using accurate mass and fragmentation patterns to annotate metabolites. We integrate automated statistical tools for multivariate analysis (e.g., PCA, PLS-DA) to identify metabolites that best discriminate between sample groups. This comprehensive automation empowers us to rapidly characterize metabolic profiles, pinpoint critical metabolic pathways, and uncover the intricate biochemical changes underlying various biological states, pushing the boundaries of systems biology and biomarker discovery.
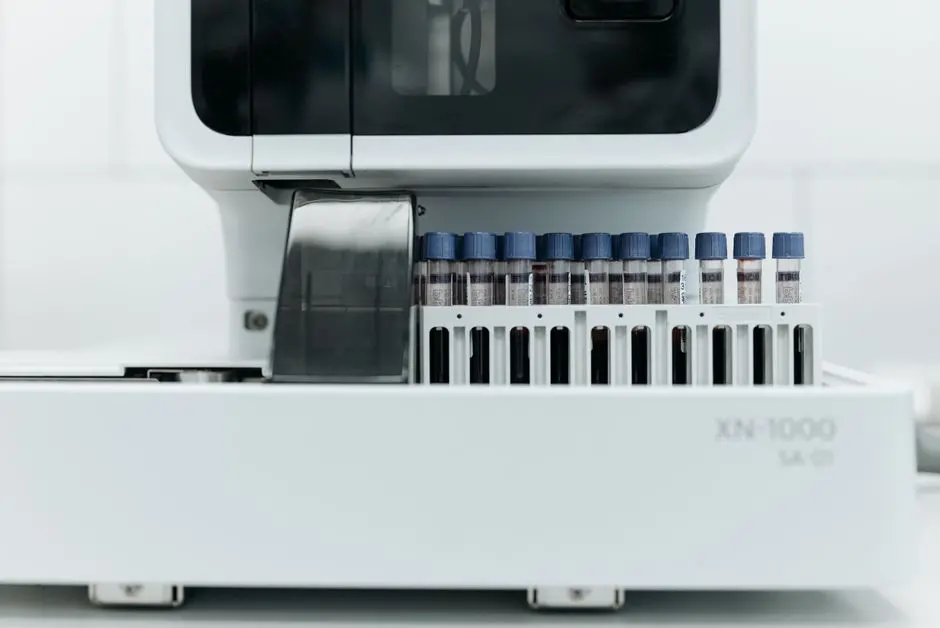
Automating Biological Image Analysis: Visual Data Transformation
Biological imaging, particularly high-throughput microscopy, generates vast quantities of visual data that are impossible to analyze manually. Automation is the linchpin for extracting quantitative insights from these complex images. Our automated pipelines begin with image preprocessing, a crucial phase that includes tasks such as background subtraction, noise reduction, and intensity normalization. Tools like Fiji (ImageJ) with its powerful scripting capabilities (macros, Python) or specialized libraries in Python (e.g., scikit-image, OpenCV) allow us to apply these operations consistently across thousands of images, ensuring uniform quality for downstream analysis.
The next critical step in automated image analysis is segmentation, where we computationally delineate objects of interest, such as cells, nuclei, or organelles, from the background. Advanced algorithms, including thresholding, watershed transforms, or machine learning-based methods (e.g., U-Net for semantic segmentation), are integrated into workflows to perform this task automatically. Automating segmentation is particularly challenging due to variability in image quality and biological heterogeneity, but successful implementation dramatically accelerates the quantification of cellular morphology, protein localization, and population-level responses. Without automation here, the extraction of accurate, unbiased measurements from large image sets remains an insurmountable bottleneck.
Once objects are segmented, automated feature extraction quantifies various characteristics for each identified object. We measure parameters such as size, shape, intensity, texture, and colocalization patterns. Software platforms like CellProfiler are specifically designed for building flexible, automated image analysis pipelines, allowing users to define a sequence of modules for segmentation, feature extraction, and measurement. This automated quantification generates numerical datasets (e.g., CSV files) that can then be subjected to statistical analysis and machine learning for classification or phenotype discovery. By fully automating the entire image analysis pipeline, we transform qualitative visual observations into robust, quantitative data, enabling high-content screening, drug discovery, and a deeper understanding of cellular processes at scale.
Architecting Integrated Automated Biological Workflows and Best Practices
The true power of automation in biology manifests when we integrate individual processing modules into comprehensive, end-to-end workflows. Architecting these integrated automated pipelines requires strategic planning and the adoption of robust frameworks. Workflow management systems (WMS) such as Nextflow, Snakemake, or Cromwell (with WDL) are indispensable tools for this orchestration. These WMS platforms allow us to define complex computational graphs, manage dependencies between tasks, handle error recovery, and execute pipelines across diverse computing environments—from local machines to cloud infrastructures. We leverage these systems to stitch together genomics, proteomics, and imaging modules, creating holistic analysis platforms that can process multi-modal biological data from a single experimental cohort.
Implementing successful automated workflows demands adherence to critical best practices. Firstly, version control is non-negotiable for all scripts, configuration files, and even reference data. Git repositories become our single source of truth, tracking every modification and enabling precise reproducibility. Secondly, containerization technologies like Docker or Singularity are paramount. We encapsulate all software dependencies—operating system, libraries, specific tool versions—within isolated environments. This eliminates the infamous “it works on my machine” problem, guaranteeing that our pipelines execute identically regardless of the underlying computational environment. This robust setup is crucial for collaborative projects and for sharing pipelines with the wider scientific community, facilitating true scientific reproducibility.
Finally, we must embed comprehensive logging and reporting within our automated workflows. Every step should generate detailed logs, capturing execution times, resource usage, and any errors encountered. Automated summary reports, often in HTML or PDF format, should provide a quick overview of key quality metrics and results. This transparency is vital for monitoring pipeline performance, debugging issues, and ensuring data integrity. We also champion continuous integration and continuous deployment (CI/CD) principles, where changes to our pipeline code automatically trigger tests, ensuring that modifications do not introduce regressions. By embracing these architectural principles and best practices, we do not merely automate tasks; we forge highly reliable, scalable, and reproducible biological data processing ecosystems, empowering continuous discovery and elevating the standard of scientific rigor in an increasingly data-intensive era.
Key Takeaways
Principles of Automated Biological Data Workflows
Automated processing is essential for managing the vast data in modern biology, driven by high-throughput techniques. It ensures reproducibility, eliminates human error, and accelerates discovery. Key principles include modularity for adaptable pipelines, clear input/output specifications, and strict version control for all components. This frees researchers for higher-level scientific inquiry.
Automated Genomics Data Processing
NGS data processing is a prime example of automation. Workflows typically involve quality control (FastQC, Trimmomatic), read alignment to a reference genome (BWA, Bowtie), and variant calling (GATK). These automated steps transform raw reads into actionable insights, enabling rapid identification of genetic variations crucial for precision medicine and population genetics.
Automated Proteomics and Metabolomics Data Analysis
Mass spectrometry data from proteomics and metabolomics demand automation for robust analysis. For proteomics, pipelines include peak picking, database searching (Mascot, MaxQuant), and quantitative analysis (label-free or labeled). Metabolomics utilizes automated peak detection, alignment (XCMS, MZmine 2), and metabolite identification against spectral libraries, followed by multivariate statistical analysis to uncover biomarkers and metabolic pathways.
Automated Biological Image Analysis
High-throughput imaging generates enormous visual data. Automation is critical for extracting quantitative data. Workflows encompass image preprocessing (noise reduction, normalization), segmentation (delineating objects like cells/nuclei), and feature extraction (quantifying size, shape, intensity). Tools like CellProfiler and libraries such as scikit-image facilitate these processes, transforming qualitative images into measurable, analyzable datasets for high-content screening.
Architecting Integrated Workflows and Best Practices
Integrating various automated modules into cohesive pipelines maximizes impact. Workflow management systems (Nextflow, Snakemake) orchestrate these complex analyses across computing environments. Best practices include rigorous version control for all code, containerization (Docker, Singularity) for reproducibility, and comprehensive logging and reporting. This approach fosters robust, scalable, and continuously reliable biological data processing ecosystems.
FAQ
-
What are the primary benefits of automating biological data processing?
Automating biological data processing offers several crucial benefits: it significantly reduces human error, ensuring consistency and accuracy across analyses. It dramatically increases processing speed and throughput, enabling analysis of massive datasets. Furthermore, it guarantees reproducibility of results, which is fundamental for scientific validation, and frees up researcher time for higher-level scientific inquiry rather than repetitive tasks.
-
What tools are commonly used to build automated biological data workflows?
We commonly utilize a suite of powerful tools. Scripting languages like Python and R form the backbone for custom analysis. Workflow management systems such as Nextflow, Snakemake, and Cromwell orchestrate complex pipelines. Containerization technologies like Docker and Singularity ensure reproducibility across environments. Specialized bioinformatics tools (e.g., BWA, GATK for genomics; MaxQuant for proteomics; CellProfiler for imaging) are integrated into these frameworks.
-
How do we ensure reproducibility in automated biological data processing?
Ensuring reproducibility involves several key strategies. We implement version control (e.g., Git) for all code and configurations. Containerization (Docker/Singularity) packages all software dependencies. We maintain meticulous documentation of pipeline parameters and execution environments. Additionally, using dedicated workflow management systems helps standardize execution and capture provenance, cementing the ability to rerun analyses identically.
-
What are the common challenges when implementing automated biological workflows?
Implementing automated workflows presents several challenges. These include the initial learning curve for programming and workflow languages, managing software dependencies and version conflicts, ensuring data quality and consistency at each pipeline stage, and the need for significant computational resources. Furthermore, integrating diverse tools and adapting to evolving biological questions often requires continuous maintenance and refinement of the pipelines.