
> Biological Data Analysis > Biological Data Processing Workflows > Optimize Biological Data: Essential Preprocessing
Optimize Biological Data: Essential Preprocessing

The era of big biological data has dawned, bringing unprecedented opportunities but also formidable challenges. Raw biological datasets, whether from genomics, transcriptomics, proteomics, or metabolomics, are inherently noisy, replete with biases, and riddled with technical artifacts. Neglecting these imperfections jeopardizes the very foundation of our scientific inquiry, leading to erroneous conclusions and wasted resources.
This critical article dissects the indispensable preprocessing steps required to transform raw, unruly biological information into clean, actionable insights. We arm you with the strategic acumen to navigate this crucial initial phase, ensuring your downstream analyses are robust, reliable, and reproductible. Forge a bedrock of data integrity; understand that mastery of these steps is not merely a technicality but a strategic imperative that directly impacts the validity of all subsequent biological discoveries. This foundational work integrates seamlessly into the broader architecture of robust analytical processes, directly supporting efficient pipelines for processing experimental biological data. Prepare to unlock the true potential hidden within your experimental results, converting complexity into clarity and uncertainty into scientific certainty. We embark on a journey to sharpen your analytical edge, transforming raw data into refined scientific truth.

Conquer the Chaos: The Strategic Imperative of Biological Data Preprocessing
In the vibrant landscape of modern biology, experimental data emerges from a crucible of biological complexity and technical nuances. This raw output, however, is rarely pristine. It is an intricate tapestry woven with biological signal, technical noise, instrument variability, and sometimes, outright errors. To extract meaningful biological insights from this complexity, we must first embark on a critical, often underestimated, strategic phase: data preprocessing. This isn't merely a housekeeping chore; it's a foundational pillar upon which all subsequent analyses – from differential expression to pathway enrichment, from biomarker discovery to machine learning model training – are built.
We recognize that unprocessed data is a minefield of potential misinterpretations. Consider the sheer scale of omics datasets: thousands of genes, proteins, or metabolites measured across dozens or hundreds of samples. Each measurement carries inherent variability. Without meticulous preprocessing, we risk propagating these biases and noise, distorting true biological signals, and ultimately deriving flawed conclusions. A compelling example arises in RNA sequencing (RNA-seq): variations in sequencing depth between samples, adapter contamination, or low-quality reads can drastically skew gene expression quantification.
Our objective in preprocessing is multifaceted: to enhance data quality, to ensure comparability across samples, and to prepare the data in a format suitable for sophisticated analytical algorithms. This initial intervention transforms chaotic raw measurements into a structured, reliable, and interpretable dataset. We validate our data's integrity, increase the signal-to-noise ratio, and proactively mitigate biases inherent in experimental designs and laboratory procedures. This strategic commitment to preprocessing empowers us to move beyond mere observation, enabling deep biological exploration with unwavering confidence. It is the crucial first strike in our campaign to decipher life's intricate codes, forging clarity from complexity.
Purify the Source: Rigorous Quality Control and Data Cleaning
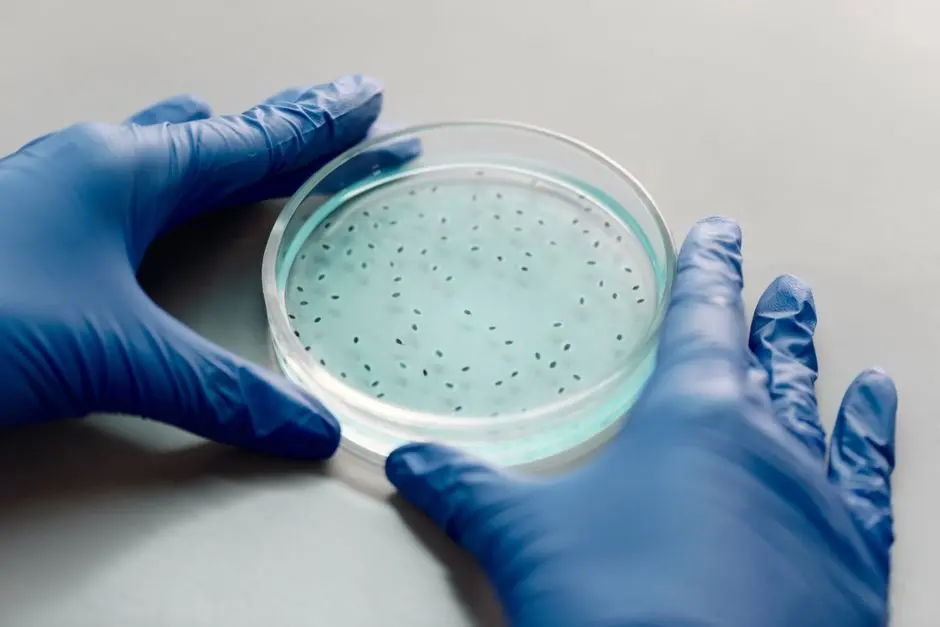
Our expedition into robust biological data analysis begins with an unwavering commitment to quality control (QC) and meticulous data cleaning. This phase is non-negotiable; it defines the purity of our analytical source. We start by assessing the raw data's intrinsic quality, identifying and mitigating any technical flaws introduced during sample preparation, sequencing, or measurement. For high-throughput sequencing data, tools like FastQC rapidly generate reports detailing read quality distributions, adapter content, and overrepresented sequences. We use these diagnostics to guide subsequent trimming and filtering operations, removing low-quality bases or entire reads that would otherwise contaminate our analysis. For example, reads with Phred quality scores below a defined threshold (e.g., < 20 or < 30) are systematically culled to preserve data integrity.
Beyond sequencing, other omics data types demand their own QC paradigms. In mass spectrometry-based proteomics, we scrutinize peak quality, retention time stability, and signal-to-noise ratios. Metabolomics data requires careful assessment of spectral alignment and blank subtraction.
A critical aspect of cleaning involves addressing missing values, a common occurrence in many biological datasets, especially in proteomics or metabolomics due to detection limits or sample loss. We must strategically decide whether to impute these missing values or to filter out features with excessive missingness. Imputation strategies range from simple methods like mean or median replacement to more sophisticated algorithms such as k-nearest neighbors (KNN) or probabilistic principal component analysis (PPCA), each chosen based on the underlying data distribution and the nature of missingness. Ignoring missing data or employing inappropriate imputation introduces severe biases.
Finally, we confront outliers: data points that deviate significantly from the expected distribution. While some outliers may represent genuine biological phenomena, many are technical artifacts. We employ statistical methods like box plots, Z-scores, or more robust Mahalanobis distance measures to identify them. Our decision to remove or transform outliers is always data-driven and justified, ensuring we preserve true biological variance while discarding spurious signals. This rigorous purification ensures our canvas is clean, ready for the next layers of insight.
Harmonize the Spectrum: Normalization and Data Transformation Strategies
With our biological data purified, our next strategic maneuver is harmonization through normalization and transformation. This phase is crucial for ensuring that observed differences between samples truly reflect biological variance, rather than systematic technical variations. Technical biases, such as differences in sequencing depth, sample loading, or instrument sensitivity, can dramatically obscure genuine biological signals. Normalization aims to correct for these non-biological differences, placing all samples on a comparable scale.
Consider RNA-seq data: simply comparing raw read counts between samples can be misleading if one sample was sequenced twice as deeply. We therefore employ normalization methods that account for library size differences. Popular techniques include Counts Per Million (CPM), Transcripts Per Million (TPM), or the more sophisticated median-of-ratios method used by DESeq2, which effectively scales samples based on reference genes. For microarray or quantitative PCR data, quantile normalization or global scaling factors are frequently applied. Our choice of normalization method is critical; it hinges on the specific data type, experimental design, and downstream analytical goals. Applying an inappropriate normalization can inadvertently remove biological signal or introduce new biases.
Beyond normalization, data transformation plays a pivotal role in preparing biological data for statistical analysis and machine learning algorithms. Many statistical tests and algorithms assume data approximate a normal distribution or exhibit homoscedasticity (equal variance). Biological data, particularly count data or intensity values, often follow skewed distributions. Logarithmic transformations (e.g., log2(x+1) for count data) are commonly applied to stabilize variance, reduce skewness, and make distributions more symmetrical, thereby enhancing the power and validity of subsequent statistical tests. For instance, a log transformation effectively compresses large differences while expanding small differences, making fold-changes more interpretable.
We also encounter situations where raw measurements span several orders of magnitude, making direct comparisons difficult. Scaling techniques, such as Z-score standardization (subtracting the mean and dividing by the standard deviation), rescale data to have zero mean and unit variance. This is particularly valuable for algorithms sensitive to feature scales, like principal component analysis (PCA) or support vector machines (SVMs), ensuring that no single feature unduly dominates the analysis. This two-pronged approach of normalization and transformation is paramount; it cultivates a level playing field, enabling us to pinpoint true biological differences with precision.
Sculpting the Landscape: Feature Engineering and Dimensionality Reduction
As our biological data becomes cleaner and harmonized, we shift our focus to sculpting its landscape, making it more amenable for deep analytical exploration. This involves strategic feature engineering and judicious dimensionality reduction, transforming high-dimensional datasets into a more interpretable and computationally tractable form. Biological datasets are often characterized by a colossal number of features (e.g., tens of thousands of genes) compared to a relatively small number of samples. This "high-dimensionality problem" presents significant challenges, including increased computational cost, heightened risk of overfitting in machine learning models, and difficulties in visualization.
Feature engineering is the art of creating new features or modifying existing ones to enhance the predictive power of a model or to better represent underlying biological phenomena. This could involve combining individual gene expression levels into pathways scores, calculating ratios of protein phosphorylation states, or deriving metabolic flux rates from enzyme activities. We apply our domain expertise here, leveraging biological knowledge to construct features that capture biologically meaningful relationships, rather than relying solely on raw measurements. For example, instead of using individual gene counts, we might calculate a "cell cycle score" based on a predefined set of cell cycle genes, offering a more robust and interpretable feature.
Complementing feature engineering, dimensionality reduction techniques are indispensable. These methods project high-dimensional data into a lower-dimensional space while preserving as much variance or relevant structure as possible. Principal Component Analysis (PCA) is a workhorse in biology, identifying orthogonal principal components that capture the maximum variance in the data. PCA allows us to visualize sample relationships in 2D or 3D plots, revealing clusters, batch effects, or experimental group separations. For more complex, non-linear structures, techniques like t-Distributed Stochastic Neighbor Embedding (t-SNE) or Uniform Manifold Approximation and Projection (UMAP) prove invaluable. These methods excel at preserving local relationships, making them ideal for visualizing single-cell RNA-seq data and identifying distinct cell populations.
The judicious application of these techniques is crucial. Over-reduction can lead to a loss of critical biological information, while insufficient reduction leaves us vulnerable to the curse of dimensionality. Our goal is to strike a delicate balance, simplifying the data for clarity and efficiency without sacrificing the intricate biological details we seek to uncover. This strategic sculpting prepares our data to reveal its deepest secrets.

Fortify Against Bias: Batch Effect Correction and Data Integration
Even after rigorous cleaning, normalization, and feature engineering, biological data harbors a persistent threat: batch effects. These systematic, non-biological variations are introduced when samples are processed in different batches, on different days, by different operators, or using distinct reagents. Batch effects can confound true biological signals, leading to spurious findings or obscuring genuine biological differences. We must actively fortify our analysis against these insidious biases. Recognizing and correcting batch effects is paramount for the validity and reproducibility of our discoveries.
We start by meticulously documenting batch information during experimental design and data collection. This metadata is invaluable for identifying and quantifying batch effects during preprocessing. Visual diagnostics, such as PCA plots or heatmaps of raw or normalized data, often reveal distinct clustering of samples by batch rather than by biological condition, serving as clear indicators of their presence.
Once identified, we employ specific computational strategies to mitigate batch effects. Popular methods include ComBat (Combatting Batch Effects), a widely adopted empirical Bayes framework that adjusts for batch effects by leveraging information across genes and batches. Other approaches like limma's `removeBatchEffect` function integrate batch information directly into linear models, allowing us to statistically account for these nuisance variables while preserving biological variation of interest. For more complex multi-omic integration scenarios, advanced techniques such as MOFA (Multi-Omics Factor Analysis) or DIABLO (Data Integration Analysis for Biomarker discovery using Latent Omics) specifically handle batch variations across diverse data types.
The challenge intensifies when integrating multiple biological datasets from different studies or platforms. This often involves harmonizing disparate data formats, correcting for platform-specific biases, and ensuring that features are comparable. Strategies for data integration can range from simple concatenation after individual normalization to more sophisticated matrix factorization methods that identify shared latent components across omics layers. Our ultimate goal is to create a cohesive, integrated dataset that maximizes biological signal and minimizes technical noise across all sources. This fortification against batch effects and adept integration transforms isolated datasets into a powerful, unified view of biological systems, empowering us to uncover robust and generalizable insights that transcend individual experiments.
Key Takeaways
Deciphering Data's Blueprint: Key Preprocessing Takeaways
Mastering biological data preprocessing is not a mere technicality; it is a strategic imperative that dictates the validity and depth of all subsequent biological discoveries.
- Quality Control is Paramount: We initiate with rigorous quality assessment, systematically identifying and eliminating technical noise, adapter contamination, and low-quality reads or samples. Tools like FastQC, and careful handling of missing values and outliers, purify our data source.
- Harmonize with Precision: Normalization corrects for systematic technical variations (e.g., sequencing depth, sample loading), ensuring comparability across samples. Data transformations (e.g., log, Z-score) stabilize variance and prepare data for robust statistical and machine learning analyses.
- Sculpt for Insight: Feature engineering leverages biological expertise to create meaningful variables, while dimensionality reduction (PCA, t-SNE, UMAP) simplifies complex datasets, making them more interpretable and computationally efficient without losing critical biological information.
- Combat Bias: We must actively identify and correct batch effects, which can confound biological signals. Techniques like ComBat or limma's
removeBatchEffectare essential for fortifying our analysis against these systemic biases and enabling robust data integration across diverse experiments.
Embrace preprocessing as an iterative, data-driven process, critical for transforming raw biological measurements into actionable, reproducible scientific knowledge. It is the foundation for unlocking true biological potential.
FAQ
-
What is the most critical error to avoid during biological data preprocessing?
The most critical error we must actively avoid is neglecting the impact of batch effects. Uncorrected batch effects can create artificial distinctions between groups or mask genuine biological signals, leading to fundamentally flawed conclusions. Always account for experimental batches in your design and apply appropriate computational correction methods during preprocessing. This oversight compromises data integrity and the reproducibility of your findings more than almost any other preprocessing error.
-
How does effective preprocessing directly influence the success of machine learning applications in biology?
Effective preprocessing is the bedrock of successful machine learning in biology; it embodies the principle of 'garbage in, garbage out.' High-quality, clean, normalized, and relevantly engineered features significantly enhance model performance, interpretability, and generalizability. By removing noise and bias, stabilizing variance, and reducing dimensionality, we enable algorithms to learn true biological patterns rather than technical artifacts. This precision dramatically improves predictive accuracy, feature selection, and the discovery of robust biomarkers or therapeutic targets, transforming potential into tangible biological insights.