
> Laboratory Techniques > PCR and DNA Amplification Methods > Optimize qPCR: Master Accurate Results for DNA Analysis
Optimize qPCR: Master Accurate Results for DNA Analysis
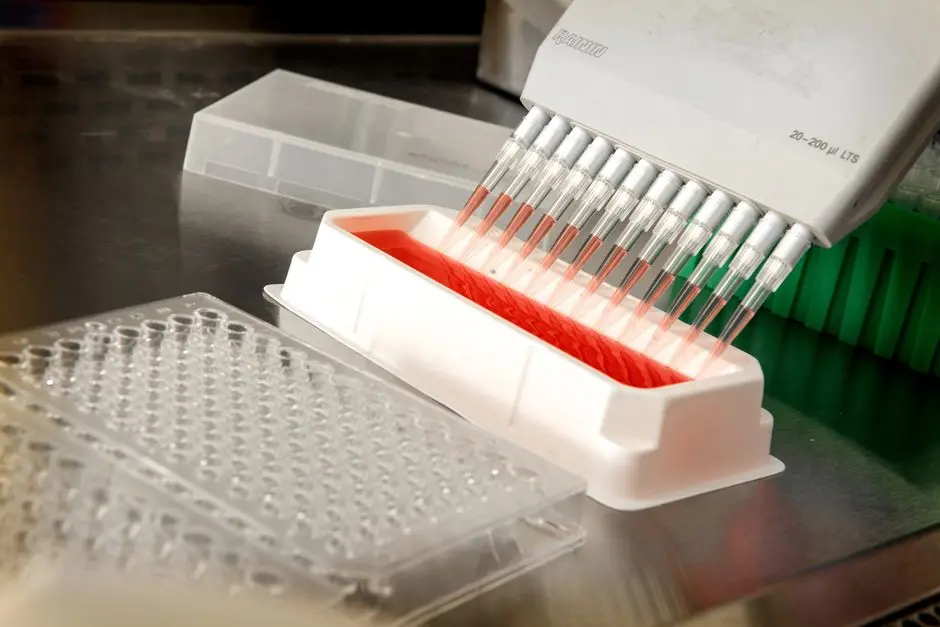
We stand at the frontier of genetic exploration, where the precision of our methods dictates the fidelity of our discoveries. Quantitative Polymerase Chain Reaction (qPCR) is an indispensable tool, a beacon guiding us through the complexities of gene expression analysis, pathogen detection, and genetic variation studies. Yet, its inherent power is directly proportional to the meticulousness of its execution. Flawed qPCR results not only undermine research integrity but can also lead to misinformed decisions in diagnostics and therapeutic development, wasting precious resources and time.
This deep dive into best practices for accurate qPCR results is your essential blueprint, designed to elevate your laboratory's output from mere data points to irrefutable biological insights. We dissect the critical variables, expose common pitfalls, and forge a strategic pathway toward reproducible, high-confidence data. From sample preparation to data interpretation, we arm you with the tactical knowledge necessary to conquer variability and unlock the full potential of your experiments. Understand the nuances that define successful amplification and quantification, building upon the foundational principles of modern PCR techniques for DNA amplification and analysis. Prepare to transform your approach, securing the accuracy that propels scientific progress forward.
Maximize Sample Integrity: The Bedrock of qPCR Accuracy
We initiate our quest for accurate qPCR by recognizing that the integrity of our starting material – DNA or RNA – is non-negotiable. Poor quality or degraded samples fundamentally corrupt downstream results, leading to diminished amplification efficiency, shifted Cq values, and ultimately, erroneous conclusions. Our first mission is to rigorously control sample extraction and purification. We must select extraction methods optimized for the specific sample type, ensuring maximal nucleic acid recovery while minimizing co-purification of inhibitors. Common inhibitors include heme from blood, humic acids from soil, or polysaccharides from plants, each capable of impeding polymerase activity. Employing validated clean-up steps, such as ethanol precipitation or specialized columns, proactively removes these obstacles.
For RNA, the gold standard for integrity assessment is the RNA Integrity Number (RIN), typically measured using microfluidic electrophoresis systems. A RIN score >7.0 is generally recommended for robust gene expression analysis, though specific applications might tolerate lower values. For both DNA and RNA, spectrophotometric analysis provides crucial purity metrics. We rigorously monitor the A260/280 ratio, aiming for values between 1.8-2.0 for DNA and 2.0-2.2 for RNA, indicating minimal protein contamination. The A260/230 ratio is equally vital, ideally >1.8, to detect residual contaminants like guanidine salts, phenols, or carbohydrates, which are potent PCR inhibitors. We must understand that even subtle deviations in these ratios can significantly impact amplification kinetics.
Crucially, we quantify nucleic acid concentration accurately using fluorometric methods (e.g., Qubit, PicoGreen), which specifically measure double-stranded DNA or RNA, proving superior to spectrophotometry for low concentration samples or those containing single-stranded nucleic acids and contaminants. We then meticulously prepare our samples, ensuring consistent input quantities across all reactions to facilitate reliable comparisons. Aliquoting samples immediately after extraction and storing them at appropriate temperatures (e.g., -80°C for RNA, -20°C for DNA) prevents degradation and minimizes freeze-thaw cycles that can shear nucleic acids. Our commitment to using nuclease-free reagents and consumables throughout the process is unwavering. This vigilant approach to sample quality lays the irrefutable groundwork for all subsequent qPCR triumphs, shielding our data from intrinsic variability.
Forge Specificity: Mastering Primer and Probe Design
The specificity and efficiency of our qPCR assay hinge critically on the design of primers and, where applicable, probes. These oligonucleotides are the molecular architects that dictate precisely which genetic sequence will be amplified and detected. Our objective is to design primers that bind with high affinity and exclusivity to the target sequence, avoiding non-specific amplification or primer-dimer formation, which deplete reagents and generate spurious signals. We must prioritize certain physicochemical parameters during design. Primers should typically be 18-24 base pairs long with a GC content of 40-60%. Crucially, their melting temperatures (Tm) must be closely matched, ideally within 1°C, to ensure synchronous annealing. We actively scan for potential secondary structures within the primers themselves (hairpins, self-dimers) and between primer pairs (hetero-dimers) using specialized in silico tools, as these structures severely impede binding and extension efficiency.
For probe-based assays (e.g., TaqMan), we also consider the probe's design. The probe’s Tm should be approximately 5-10°C higher than the primers' Tm to ensure it binds before primer extension begins. We meticulously check for a lack of a G residue at the 5' end of TaqMan probes to prevent quenching issues. The reporter dye and quencher pair selection is also vital, ensuring minimal spectral overlap if multiplexing, and optimal signal generation. After design, we rigorously validate primer and probe specificity empirically. We perform standard PCR and visualize products on an agarose gel to confirm a single band of the expected size. For SYBR Green assays, a melt curve analysis is indispensable, revealing distinct peaks corresponding to specific amplification products and identifying any primer-dimers or non-specific amplicons. We optimize primer concentrations, typically between 100 nM and 500 nM, by running a primer matrix to identify the sweet spot that maximizes efficiency and minimizes non-specific products. This meticulous architectural planning safeguards our assay's precision.
Precision Pipetting: Safeguarding Reagent Purity and Setup
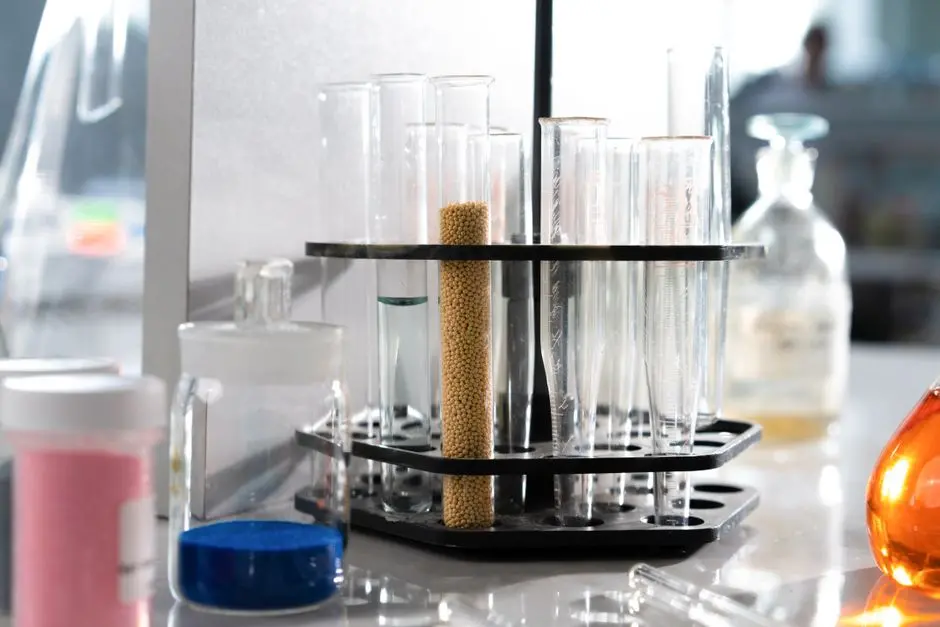
The integrity of our qPCR results is directly proportional to the precision and cleanliness maintained during reaction setup. Contamination stands as the most insidious threat, capable of obliterating our data. We mandate a rigorous workflow, beginning with dedicated, physically separated workstations for pre- and post-PCR activities. This compartmentalization prevents the carryover of amplified products, a common source of false positives. All reagents must be nuclease-free and meticulously handled. We store master mixes, primers, probes, and enzymes according to manufacturer specifications, typically at -20°C or -80°C, and limit freeze-thaw cycles by preparing appropriate aliquots.
Our pipetting technique must be impeccable. We use calibrated pipettes exclusively and execute reverse pipetting for viscous solutions to ensure accurate volumes. Each reaction component requires careful mixing, but we avoid frothing or excessive vortexing, which can denature enzymes. A crucial step involves the meticulous preparation of a master mix containing all common reagents (buffer, dNTPs, polymerase, primers, probes, water). This strategy minimizes pipetting variability across individual wells and enhances reproducibility. The template DNA/RNA is then added separately to each well. We invariably include a battery of controls in every experiment: a no-template control (NTC) to detect reagent contamination, a no-reverse transcriptase control (for RT-qPCR) to identify genomic DNA contamination, and positive controls to verify assay performance. These controls serve as invaluable checkpoints, immediately flagging any procedural errors or reagent issues. The final reaction assembly demands swiftness and accuracy, ideally on ice, to maintain enzyme stability. We seal plates thoroughly to prevent evaporation, ensuring consistent reaction volumes throughout the thermal cycling. This meticulous attention to detail during setup is our bulwark against error, forging data we can trust.

Orchestrate Amplification: Optimize Thermal Cycling Parameters
Orchestrating the thermal cycling parameters is paramount to achieving maximum efficiency and specificity in qPCR. Each step – denaturation, annealing, and extension – must be meticulously calibrated to the specific enzyme, primers, and target sequence. We initiate our cycle with a thorough initial denaturation (e.g., 95°C for 5-10 minutes) to fully denature template DNA and activate hot-start polymerases, preventing non-specific amplification during setup. The cycling phase typically consists of 40-45 cycles, each commencing with denaturation (e.g., 95°C for 15-30 seconds). We ensure this temperature and duration are sufficient to separate DNA strands without excessively degrading the polymerase.
The annealing temperature is arguably the most critical parameter, dictating primer binding specificity. We determine its optimum empirically, often through a gradient PCR, starting 2-5°C below the calculated Tm of the primers. A robust annealing temperature minimizes non-specific binding while maximizing specific amplification, typically ranging from 55-65°C for 15-60 seconds. An extension step (e.g., 60-72°C for 15-60 seconds) follows, synthesizing new DNA strands. For typical qPCR amplicons <200 bp, a short extension suffices. In two-step RT-qPCR, we also optimize the reverse transcription step, considering temperature and time for efficient cDNA synthesis without significant RNA degradation.
We critically evaluate ramp rates, as excessively fast ramps can lead to temperature overshoot or undershoot, affecting enzyme activity and denaturation efficiency. Many modern qPCR instruments allow for fine-tuning these rates. For SYBR Green assays, a melt curve analysis (incremental temperature increase from 60°C to 95°C) is indispensable, immediately following amplification. This analysis provides a “fingerprint” of products, allowing distinction of specific amplicons from primer-dimers or non-specific products based on distinct melting temperatures. We strive for a single, sharp peak, confirming assay specificity and preventing misinterpretation of quantification data. This precise orchestration of thermal events unlocks the true potential of our qPCR reactions.
Unveil Insights: Master qPCR Data Analysis and Interpretation
The journey from raw fluorescence data to meaningful biological conclusions demands a rigorous and systematic approach to data analysis and interpretation. Our primary objective is to accurately determine the quantification cycle (Cq) value – the cycle number at which fluorescence crosses a defined threshold. We must set the baseline phase correctly, typically encompassing the cycles where background fluorescence is stable, prior to exponential amplification. An improperly set baseline can skew Cq values, particularly for samples with low target copy numbers. The fluorescence threshold should be positioned within the exponential phase of the amplification curve, above background noise but below the plateau phase. Automatic threshold setting by software often requires manual verification to ensure consistency across all samples and experiments.
For absolute quantification, we construct a standard curve using a series of known target concentrations. This curve must exhibit a high R² value (>0.99) and an amplification efficiency between 90-110% (slope of -3.58 to -3.10). A standard curve's reliability is paramount; deviations indicate assay inefficiencies or issues with standards. Relative quantification, comparing target gene expression between different samples, typically employs the ΔΔCq method. Here, we normalize target gene expression to stable reference genes (housekeeping genes) and then calculate fold changes relative to a control group. The selection and validation of suitable reference genes are critical; we empirically test several candidates for stability across all experimental conditions, using tools like geNorm or NormFinder. We always utilize at least two validated reference genes for robust normalization.
Melt curve analysis, particularly for SYBR Green assays, provides invaluable post-amplification quality control, identifying single, specific amplicons. Any multiple peaks or broad peaks signal non-specificity or primer-dimer formation, invalidating the corresponding Cq values. We actively apply the Minimum Information for Publication of Quantitative Real-Time PCR Experiments (MIQE) guidelines, ensuring transparency and reproducibility in our reporting. Statistical validation, including ANOVA or t-tests, confirms the significance of observed differences. Recognizing and managing outliers through established statistical methods prevents skewed results. This methodical interpretation strategy transmutes raw data into definitive biological understanding, powering our scientific advancement.
Maintain Excellence: Calibrate qPCR Equipment Rigorously
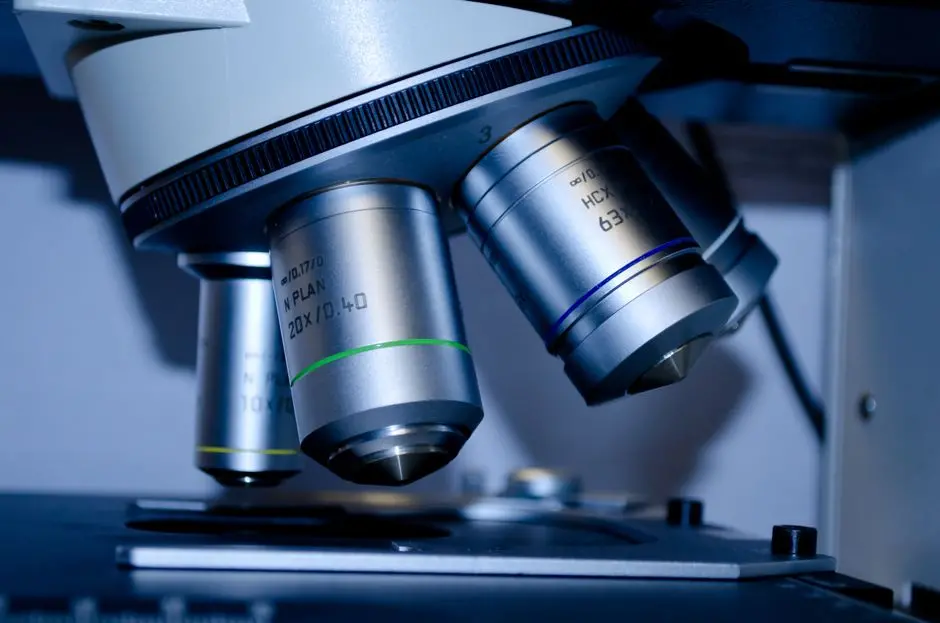
Our commitment to accurate qPCR results extends beyond reagent quality and meticulous setup; it encompasses the proactive maintenance and rigorous calibration of our qPCR instrumentation. The cycler itself, the thermal block, and the optical detection system must function flawlessly to deliver consistent and reliable data. We enforce a stringent schedule for instrument calibration, typically annually or as recommended by the manufacturer. This involves temperature verification across the thermal block to ensure uniformity, preventing well-to-well temperature variations that can significantly impact amplification kinetics and Cq values. We utilize specialized calibration plates or external temperature probes to confirm the accuracy of programmed temperatures.
Equally critical is the calibration of the optical detection system. We ensure the accuracy and linearity of fluorescence measurements across the entire dynamic range, using dye-specific calibration kits provided by the instrument manufacturer. These calibrations correct for variations in excitation and emission optics, detector sensitivity, and potential photobleaching, which are essential for precise quantification, especially in multiplex assays. Neglecting optical calibration can lead to systematic errors in fluorescence detection, directly affecting Cq determination and ultimately, quantitative accuracy.
Routine maintenance is a non-negotiable aspect of operational excellence. We regularly clean the instrument’s plate stage and optical components, removing dust or spills that can interfere with signal detection. Software updates, when available, are promptly installed to leverage the latest algorithms for data analysis and instrument control. We proactively monitor for any unusual instrument behavior, such as inconsistent baseline noise, erratic amplification curves, or unexpected Cq shifts, investigating and addressing these issues immediately. A well-maintained and precisely calibrated instrument minimizes technical variability, acting as a silent, yet powerful, partner in our pursuit of irrefutable qPCR data. This unwavering dedication to equipment integrity fortifies the foundations of our experimental reliability.
Key Takeaways
Sample Purity is Paramount
Rigorously assess DNA/RNA integrity (RIN), purity (A260/280, A260/230), and quantify accurately (fluorometry). Actively mitigate PCR inhibitors to ensure a clean starting material for robust amplification.
Primer/Probe Design Dictates Specificity
Meticulously design oligonucleotides for optimal Tm, GC content, and a lack of secondary structures. Empirically validate primer and probe specificity with melt curve analysis and gel electrophoresis to prevent non-specific amplification.
Precision in Setup, Vigilance Against Contamination
Utilize dedicated, separated workstations, calibrated pipettes, and nuclease-free reagents. Implement comprehensive controls (e.g., No-Template Control, positive control, No-Reverse Transcriptase Control) in every run to identify and prevent contamination and assay issues.
Optimize Thermal Cycling for Efficiency
Calibrate initial denaturation, annealing, and extension steps for your specific assay and polymerase. Employ gradient PCR for annealing temperature optimization and utilize melt curves (for SYBR Green) for post-amplification product confirmation.
Rigorous Data Analysis and Interpretation
Correctly set baselines and thresholds for Cq determination. Ensure standard curve quality (R² >0.99, 90-110% efficiency). Crucially, validate reference genes for stable normalization and adhere to MIQE guidelines for transparent reporting.
Maintain Calibrated Equipment
Regularly calibrate qPCR instruments for thermal block uniformity and optical detection linearity. Implement routine cleaning and timely software updates to minimize technical variability and ensure consistent instrument performance.
FAQ
-
What are the most common inhibitors in qPCR and how do we mitigate them for accurate results?
We frequently encounter various inhibitors that compromise qPCR accuracy by impeding polymerase activity or interfering with fluorescence detection. Common culprits include:
- Heme: From blood samples.
- Humic acids: Found in soil and plant extracts.
- Polysaccharides: Often co-extracted from plant tissues.
- Guanidine salts, Phenols, Ethanol: Residual chemicals from nucleic acid extraction protocols.
- EDTA: High concentrations can chelate Mg<sup>2+</sup>, a vital cofactor for polymerase.
To mitigate these, we must employ optimized extraction kits tailored to specific sample types. Implementing rigorous wash steps during purification is crucial. We can also dilute problematic samples, as this reduces inhibitor concentration, though it also reduces target concentration. Incorporating PCR enhancers (e.g., BSA, TWEEN 20) in the reaction master mix can sometimes counteract inhibition. Running a spike-in control, where a known amount of target is added to a sample extract, definitively identifies the presence and impact of inhibitors, allowing us to adjust our approach.
-
How do we properly validate reference genes for reliable relative quantification in qPCR?
Validation of reference genes (housekeeping genes) is critical for accurate relative quantification, as their expression stability must remain constant across all experimental conditions. We do not assume stability; we empirically confirm it. Our process involves:
- Initial Candidate Selection: We choose several commonly used reference genes (e.g., GAPDH, ACTB, 18S rRNA) and others potentially stable in our specific experimental system.
- qPCR of Candidates: We perform qPCR on all candidate reference genes across a representative set of our experimental samples.
- Stability Analysis: We analyze the Cq values using specialized software tools such as geNorm, NormFinder, or BestKeeper. These algorithms evaluate gene expression stability based on various statistical models, providing rankings or stability values. geNorm, for example, identifies the two most stable genes and calculates a normalization factor.
- Minimum Number: We aim to use at least two, preferably three, validated reference genes for normalization to achieve robust and reproducible results. The normalization factor derived from these stable genes is then applied to normalize target gene expression data. This rigorous validation prevents erroneous interpretations stemming from fluctuating reference gene expression.
-
What are the key indicators of a low-quality qPCR standard curve, and how do we troubleshoot them?
A reliable standard curve is indispensable for absolute quantification and assessing assay efficiency. Key indicators of a low-quality curve include:
- Low R² Value (<0.99): This suggests poor linearity between Cq values and template concentration, indicating inconsistencies in dilutions, pipetting errors, or issues with standards.
- Amplification Efficiency Outside 90-110%: A slope deviating significantly from -3.32 (which corresponds to 100% efficiency) points to suboptimal primer design, inhibitors, or sub-optimal thermal cycling parameters. A slope of -3.58 to -3.10 is acceptable (90-110% efficiency).
- Irregular Cq Values: Non-sequential Cq values across the dilution series, or Cq values that do not decrease by approximately 3.32 for each 10-fold dilution, signal problems with template preparation or reaction setup.
To troubleshoot, we first verify the accuracy of our standard dilutions using a spectrophotometer or fluorometer. We then re-optimize primer concentrations and annealing temperatures. We also assess sample purity for inhibitors. Ensuring precise pipetting, using high-quality reagents, and verifying instrument calibration are fundamental steps. Re-running the standard curve with fresh dilutions and optimized conditions usually resolves these issues, restoring confidence in our quantitative data.