
> Laboratory Techniques > PCR and DNA Amplification Methods > Quantifying Gene Expression: A qPCR Precision Protocol
Quantifying Gene Expression: A qPCR Precision Protocol
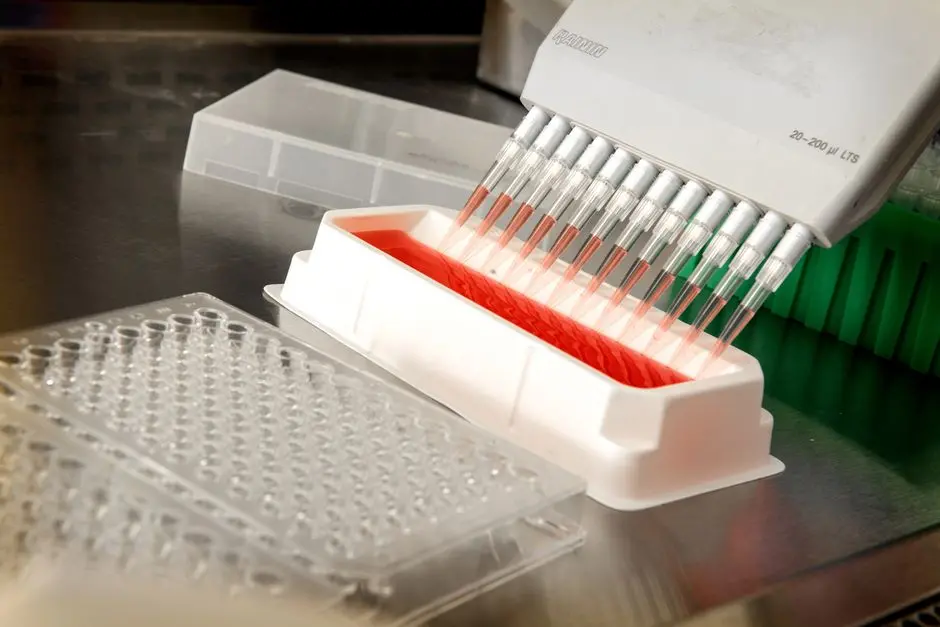
Gene expression stands as the pulsating core of biological functionality, dictating cellular identity, response to stimuli, and disease progression. Unlocking its precise measurement empowers researchers to decipher complex biological pathways, validate drug targets, and diagnose pathologies with unparalleled accuracy. We embark on a journey to master Quantitative Polymerase Chain Reaction (qPCR), a technique that has revolutionized our ability to quantify genetic material. This article dissects the intricate methodology of qPCR, transforming theoretical understanding into actionable laboratory prowess. We illuminate the foundational principles that allow qPCR to precisely gauge gene expression, explore critical experimental design considerations, and equip you with robust data analysis strategies. Prepare to elevate your research, for true biological insight flows from meticulous quantification. This journey into advanced nucleic acid quantification complements our exploration of modern PCR techniques for DNA amplification and analysis, revealing how real-time precision reshapes our understanding of life's molecular symphony.

The Core Mechanism of qPCR – From RNA to Quantification
Quantitative Polymerase Chain Reaction (qPCR), often referred to as Real-Time PCR, operates on a principle of amplifying a specific DNA sequence while simultaneously detecting and quantifying the accumulating product in real-time. Unlike conventional PCR, which provides an end-point qualitative assessment, qPCR illuminates the kinetics of amplification. We commence this precision protocol by extracting total RNA from our biological sample – the blueprint of gene expression. This RNA then undergoes a critical transformation: reverse transcription. Specialized reverse transcriptase enzymes synthesize a complementary DNA (cDNA) strand from the mRNA template. This cDNA, a more stable molecule, becomes the starting material for the subsequent amplification phase, accurately reflecting the initial gene expression level. A crucial step involves ensuring RNA integrity and purity, as degraded RNA or contaminants severely compromise downstream accuracy.
The core of quantification hinges on the fluorescent detection chemistry. Two primary strategies dominate the field: intercalating dyes like SYBR Green and sequence-specific fluorescent probes, notably TaqMan probes. SYBR Green, a non-specific DNA-binding dye, emits fluorescence upon binding to any double-stranded DNA. As target DNA amplifies, more dye binds, increasing the overall fluorescent signal. While cost-effective, its non-specificity mandates careful melt curve analysis to confirm desired product formation and detect primer dimers or non-specific amplification, which can skew results. In contrast, TaqMan probes offer superior specificity, significantly reducing the risk of false positives. These probes carry a reporter fluorophore at their 5' end and a quencher at their 3' end. When intact, the quencher suppresses the reporter’s fluorescence. During each amplification cycle, the Taq DNA polymerase's intrinsic 5'–3' exonuclease activity degrades the bound probe, physically separating the reporter from the quencher. This irreversible separation leads to a measurable increase in fluorescence directly proportional to the amount of amplified DNA. This real-time fluorescent signal provides the fundamental data for quantitative measurement. The cycle threshold (Cq) value, defined as the cycle number at which the fluorescence signal crosses a predefined threshold above the baseline, becomes our critical metric. Crucially, the Cq value exhibits an inverse relationship with the initial quantity of the target nucleic acid in the sample: a lower Cq signifies a higher initial amount of target.
Designing Your qPCR Experiment for Unassailable Data
Achieving truly unassailable qPCR data mandates meticulous experimental design, where precision in every detail amplifies success. The foundation begins with primer and probe design. We must engineer primers (typically 18-25 nucleotides) that are highly specific to the target gene, flanking a small amplicon (usually 70-200 bp). Crucial parameters include similar melting temperatures (Tm) for primer pairs, avoidance of secondary structures, and prevention of primer-dimer formation. For probe-based assays, the probe itself demands careful placement within the amplicon, ensuring its Tm is approximately 6-10°C higher than the primers and that it does not contain a G at its 5' end, which can quench the reporter. Leveraging specialized software for primer/probe design is non-negotiable for optimal results, systematically minimizing off-target amplification.
Next, we rigorously address template quality and quantity. RNA must be isolated free from PCR inhibitors (e.g., heparin, heme, phenol) and assessed for integrity using spectrophotometry (A260/A280 and A260/A230 ratios) and ideally, gel electrophoresis or a bioanalyzer. Degradation significantly impacts reverse transcription efficiency. The initial amount of RNA or cDNA introduced into the reaction must fall within the linear detection range of the assay, avoiding both excess (leading to inhibition) and scarcity (resulting in stochastic effects). The choice of reverse transcriptase enzyme is also pivotal; highly efficient enzymes are paramount for converting low-abundance transcripts. Finally, we must construct a comprehensive panel of controls. A 'no-template control' (NTC) reveals contamination in reagents. A 'no-reverse transcriptase control' (NTC-RT) identifies genomic DNA contamination within the RNA sample. Positive controls (known target concentration) validate assay performance, and negative controls (unrelated sample) ensure specificity. Adherence to MIQE guidelines (Minimum Information for Publication of Quantitative Real-Time PCR Experiments) establishes a benchmark for reproducibility and transparency, forging robust, publishable data.
Decoding the Data – Absolute vs. Relative Quantification
Once the qPCR run concludes, the raw fluorescence data demands expert interpretation to reveal meaningful biological insights. We fundamentally approach quantification through two primary methodologies: absolute and relative quantification. Absolute quantification determines the exact number of target molecules in a sample. This method necessitates a standard curve generated from a dilution series of known target concentrations (e.g., linearized plasmid DNA or synthetic oligonucleotides). By plotting the Cq values against the log10 of the initial copy number, we derive a standard curve. The Cq values of unknown samples are then interpolated onto this curve to precisely determine their initial copy numbers. This approach is invaluable for applications like pathogen load quantification or DNA copy number variation analysis, where exact molecular counts are paramount. Its accuracy hinges entirely on the quality and precision of the standard curve, demanding rigorous preparation and validation, including assessing efficiency and R2 values.
Conversely, relative quantification assesses changes in gene expression levels between different experimental conditions, typically expressed as fold-changes. This is the more commonly employed method for comparing gene expression in treated versus untreated cells, or diseased versus healthy tissues. The cornerstone of relative quantification involves normalizing target gene expression to one or more reference genes (also known as housekeeping genes). These reference genes must exhibit stable expression across all experimental conditions; their validation is a non-negotiable prerequisite. Common methods include the comparative Cq method (ΔΔCt method). We calculate the ΔCt (Cq_target - Cq_reference) for each sample, then the ΔΔCt (ΔCt_experimental - ΔCt_control). The fold-change is then calculated as 2-ΔΔCt. This mathematical transformation directly translates Cq differences into expression ratios.
Crucial to this analysis is the evaluation of amplification plots, ensuring consistent baselines and exponential phases, and melt curves (for SYBR Green assays) to confirm product specificity. A single, sharp peak in the melt curve indicates specific amplification, while multiple peaks or shoulders flag non-specific products or primer dimers, invariably invalidating quantification. Mastering these analytical distinctions empowers us to extract profound biological narratives from our raw data, providing robust evidence for gene regulation. Remember, inadequate normalization or non-specific amplification fundamentally undermines any quantitative claim.
<p><strong>Conceptual ΔΔCt Calculation:</strong></p><ul><li><p><strong>Step 1: Calculate ΔCt for each sample.</strong><br/><code>ΔCt (Sample) = Cq (Target Gene in Sample) - Cq (Reference Gene in Sample)</code></p></li><li><p><strong>Step 2: Calculate ΔΔCt.</strong><br/>Choose a control group (e.g., untreated, healthy).<br/><code>ΔΔCt = ΔCt (Experimental Sample) - Average ΔCt (Control Group)</code></p></li><li><p><strong>Step 3: Calculate Fold Change.</strong><br/><code>Fold Change = 2</code><sup><code>-ΔΔCt</code></sup></p></li></ul>
Validating Your qPCR Assay: Efficiency, Specificity, and Controls
The credibility of any qPCR experiment rests firmly on the rigorous validation of its underlying assay. We must systematically confirm that our system performs optimally and specifically. A cornerstone of this validation is determining amplification efficiency. Ideally, PCR efficiency should be close to 100%, meaning the amount of product doubles with each cycle. Efficiency is derived from the slope of the standard curve: Efficiency = 10(-1/slope) - 1. An acceptable efficiency range typically spans 90-110% (slope between -3.58 and -3.10). Deviations outside this range indicate sub-optimal assay performance, necessitating primer re-design, annealing temperature adjustments, or reagent optimization. Concurrently, the R-squared (R2) value of the standard curve must be >0.99, indicating excellent linearity across the dynamic range, a prerequisite for accurate quantification.
Primer specificity requires constant vigilance. Beyond in silico design, we empirically confirm specificity through melt curve analysis (for SYBR Green assays) and gel electrophoresis of a subset of PCR products. A single, sharp melt peak at the expected temperature confirms the amplification of a single product. Gel analysis further verifies the amplicon size. The systematic inclusion of various controls is not merely good practice, but a critical component of validation, bolstering confidence in our results. We deploy 'no-template controls' (NTC) to detect reagent contamination, 'no-reverse transcriptase controls' (NTC-RT) to rule out genomic DNA amplification from RNA samples, and positive controls with known targets to verify the assay's ability to detect. Furthermore, we mandate technical replicates (usually triplicates) for each sample to assess experimental variability and biological replicates across different samples to capture natural biological variation. Adhering to the MIQE guidelines (Minimum Information for Publication of Quantitative Real-Time PCR Experiments) is paramount. These comprehensive guidelines stipulate minimum experimental details required for publishing qPCR data, promoting transparency, reproducibility, and high-quality scientific reporting. Embracing these validation pillars ensures our qPCR data stands unassailable, ready to drive impactful biological conclusions.
Troubleshooting qPCR Challenges and Advanced Applications
Even with meticulous planning, qPCR experiments can present formidable challenges. We must proactively identify and conquer common pitfalls to ensure data integrity. A frequent adversary is PCR inhibition, where substances in the sample (e.g., humic acid, melanin, heparin) interfere with polymerase activity. Signs include high Cq values, reduced amplification efficiency, or no amplification at all. Diluting the cDNA template can often mitigate inhibition, as can employing inhibitor-resistant polymerases or alternative RNA extraction methods. Another pervasive issue is the formation of primer dimers – short, non-specific amplification products resulting from primers annealing to each other. These consume reagents and compete with target amplification, leading to inaccurate Cq values. Visualizing primer dimers on a gel or via melt curve analysis (lower Tm peak) is crucial. Remedial actions include re-designing primers, optimizing primer concentrations, using hot-start polymerases, or increasing annealing temperature. Poor RNA quality or quantity, as previously highlighted, remains a fundamental barrier; always re-assess integrity if Cq values are inconsistent or unexpectedly high.
Beyond troubleshooting, the versatility of qPCR extends into numerous advanced applications, driving innovation across biological disciplines. We leverage its precision for pathogen detection and quantification, identifying viral loads (e.g., HIV, COVID-19) or bacterial presence with high sensitivity. In oncology, qPCR enables sensitive detection of minimal residual disease or specific cancer biomarkers. Its capacity for detecting single nucleotide polymorphisms (SNPs) via allele-specific probes offers insights into genetic predispositions and pharmacogenomics. Furthermore, the realm of microRNA (miRNA) and long non-coding RNA (lncRNA) analysis heavily relies on qPCR, albeit with specialized reverse transcription chemistries, to explore these critical regulatory molecules. For gene copy number variation (CNV) studies, qPCR provides a high-throughput, quantitative method to assess duplications or deletions. The future of qPCR integrates increasingly with high-throughput platforms and automation, pushing towards digital PCR (dPCR) for even more absolute and precise quantification without relying on standard curves, promising a new era of ultra-sensitive molecular diagnostics. Continuously optimizing our protocols and staying abreast of technological advancements ensures we remain at the forefront of biological discovery.
Key Takeaways
Core Principles of qPCR
qPCR quantifies DNA amplification in real-time via fluorescent detection. It begins with RNA extraction and reverse transcription to cDNA. Fluorescent strategies include non-specific SYBR Green and highly specific TaqMan probes. The Cycle threshold (Cq) value, where fluorescence crosses a baseline, inversely correlates with initial target quantity.
Precision Experimental Design
Successful qPCR hinges on meticulous design: highly specific primers/probes (70-200 bp amplicons, appropriate Tm), high-quality, inhibitor-free RNA/cDNA templates, and efficient reverse transcriptase. Essential controls (NTC, NTC-RT, positive/negative) are non-negotiable for validating specificity and detecting contamination. Adherence to MIQE guidelines ensures reproducibility.
Data Quantification & Interpretation
Quantification occurs via absolute methods (using a standard curve to determine exact copy numbers) or relative methods (comparing fold-changes between samples, typically using the ΔΔCt method). Normalization with validated stable reference genes is critical for relative quantification. Analysis of amplification plots and melt curves confirms product specificity and assay performance, preventing misinterpretation.
Troubleshooting & Advanced Horizons
Common qPCR issues include PCR inhibition (mitigate via dilution, resistant polymerases) and primer dimers (re-design primers, optimize concentrations). Poor RNA quality remains a constant threat to accuracy. Beyond gene expression, qPCR finds advanced applications in pathogen detection, SNP analysis, microRNA quantification, and gene copy number variation, continuously evolving with technologies like digital PCR.
FAQ
-
What is the fundamental difference between qPCR and conventional PCR?
The fundamental distinction lies in their detection methods and temporal quantification. Conventional PCR yields an end-point, qualitative or semi-quantitative result, visualizing amplified DNA on an agarose gel after all cycles are complete. It only indicates presence or absence and relative abundance. qPCR, however, monitors DNA amplification in real-time, cycle by cycle, through fluorescent detection. This real-time measurement allows for precise quantification of the initial target material based on the cycle threshold (Cq) value, providing absolute or relative numerical data on gene expression or DNA copy number. We are not just detecting, we are precisely measuring the kinetics of amplification.
-
How do I select the most appropriate reference gene for my qPCR experiment?
Selecting a stable reference gene is paramount for accurate relative quantification. We do not guess; we validate. The ideal reference gene exhibits consistent expression levels across all experimental conditions, tissues, and treatments. We must empirically test several candidate reference genes (e.g., GAPDH, β-actin, 18S rRNA) using stability analysis software like geNorm or NormFinder. These tools statistically evaluate expression variability and identify the most stable gene(s) for your specific experimental setup. Using an unstable reference gene will invalidate your normalization, leading to erroneous interpretations of target gene expression. Multiple reference genes often yield more robust normalization.
-
What does the Cq value represent in qPCR, and why is it crucial for quantification?
The Cycle threshold (Cq) value, also known as Ct value, signifies the specific cycle number at which the fluorescence signal generated by the amplification of a target sequence crosses a predetermined threshold above the baseline. This threshold is set within the exponential phase of the amplification curve, where the reaction efficiency is optimal and product accumulation is directly proportional to the initial template amount. The Cq value is crucial because it is inversely proportional to the initial quantity of target nucleic acid in the sample: a lower Cq indicates a higher initial target concentration, while a higher Cq suggests a lower initial concentration. It is our primary quantitative metric.
-
What are common inhibitors encountered in qPCR, and how can we mitigate their impact?
Various substances present in biological samples or extraction reagents can inhibit the PCR reaction, leading to false negatives or inaccurate quantification. Common inhibitors include heme (from blood), humic acids (from soil), melanin (from skin/hair), polysaccharides, phenol, ethanol, and heparin. Signs of inhibition include high Cq values, reduced amplification efficiency, or a complete lack of amplification. To mitigate their impact, we can employ several strategies: optimize RNA/DNA extraction protocols to ensure inhibitor removal, dilute the cDNA template (as diluting inhibitors often improves results), or utilize PCR polymerases specifically engineered for inhibitor resistance. A dilution series of your sample often helps identify and overcome inhibition.
-
Can qPCR differentiate between different splice variants of a gene?
Yes, qPCR can indeed differentiate and quantify different splice variants of a single gene, provided careful assay design. We achieve this by designing primer pairs and/or fluorescent probes that specifically target the unique exon junctions or sequences present only in a particular splice variant. For example, one primer can span an exon-exon junction specific to one variant, while another pair targets a different junction unique to another. This strategic placement ensures that only the intended splice variant is amplified and detected. This capability is invaluable for studying complex gene regulation and its role in disease, where isoform-specific expression can have profound functional consequences.